

The 2021 Nyiragongo Eruption, Democratic Republic of the Congo: Crustal deformation detected by ALOS-2 data
Crustal Deformation Observed by Synthetic Aperture Radar (SAR)Released: June 1, 2021, update: June 7, 2021 Japanese version of this page SummaryVolcanic unrest has been observed at the Nyiragongo volcano in Democratic Republic of the Congo since May 22, 2021 (UTC). To measure the crustal deformation caused by this unrest, we applied various analysis using ALOS-2/PALSAR-2 data.
SAR Interference Pair
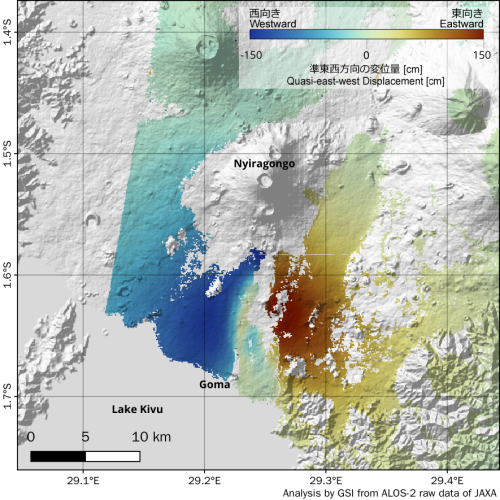
*1 F: Stripmap (Fine) * Figs. 1, 2 were drawn based on the decomposition analysis using Figs 3, 4. (cf. ALOS-2 Project / PALSAR-2 (JAXA)) 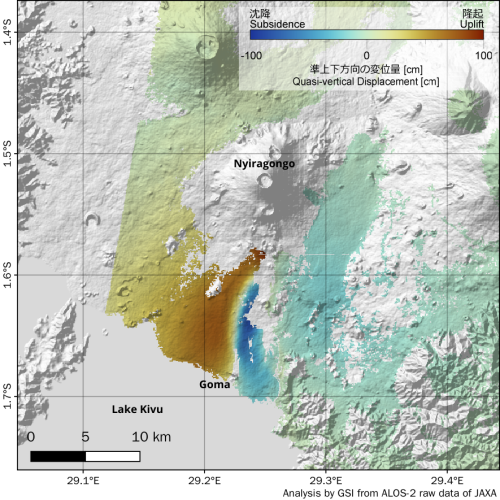
Fig. 2 Quasi-vertical Displacement[PNG: 0.95MB] SAR Interferograms
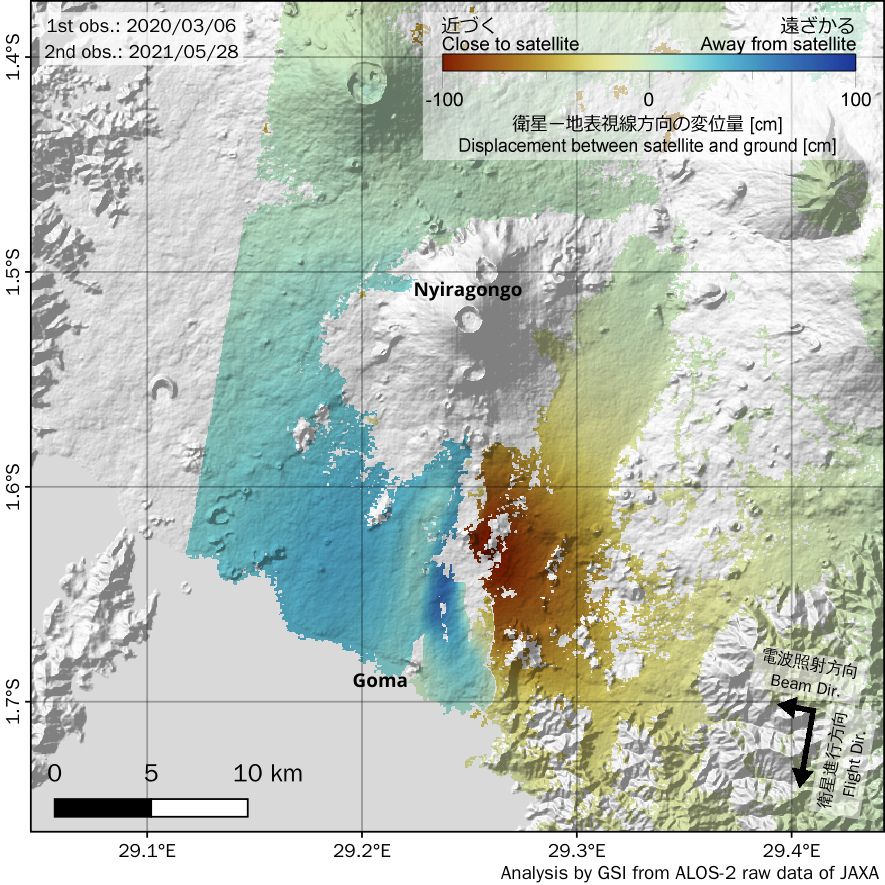
Fig. 3 Distribution of displacement in the line-of-sight direction between satellites and surface from 2020-03-06 to 2021-05-28. (Unwrap image) [PNG: 0.90MB] 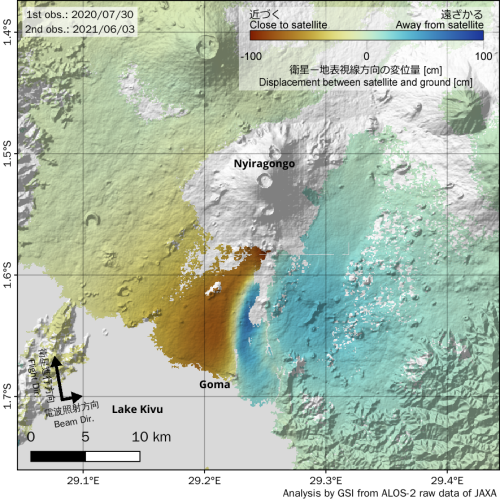
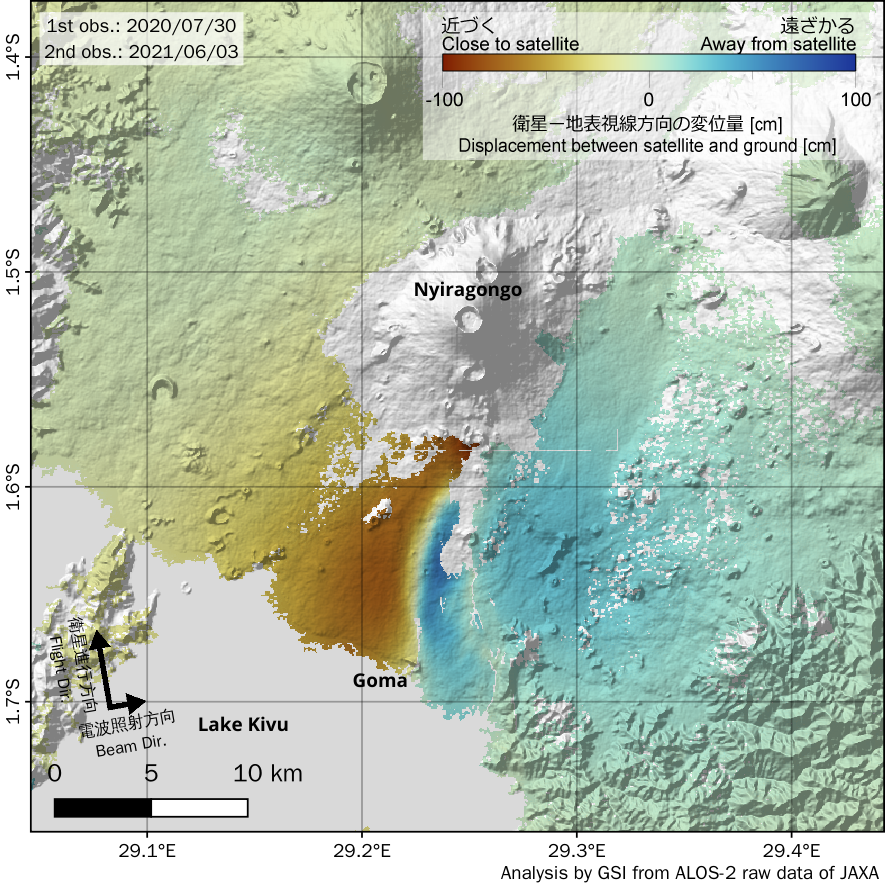
Fig. 4 Distribution of displacement in the line-of-sight direction between satellites and surface from 2020-07-30 to 2021-06-03. (Unwrap image) [PNG: 1.06MB] 
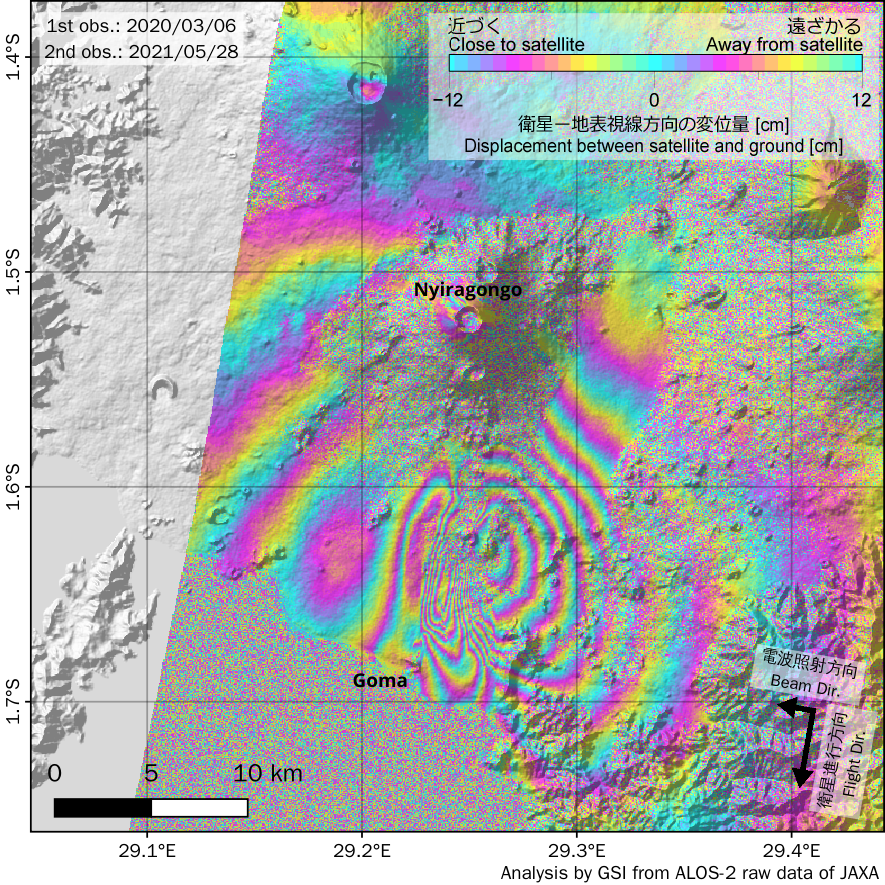
Fig. 5 SAR interferogram (2020-03-08/2021-05-28) [PNG: 1.39MB] 
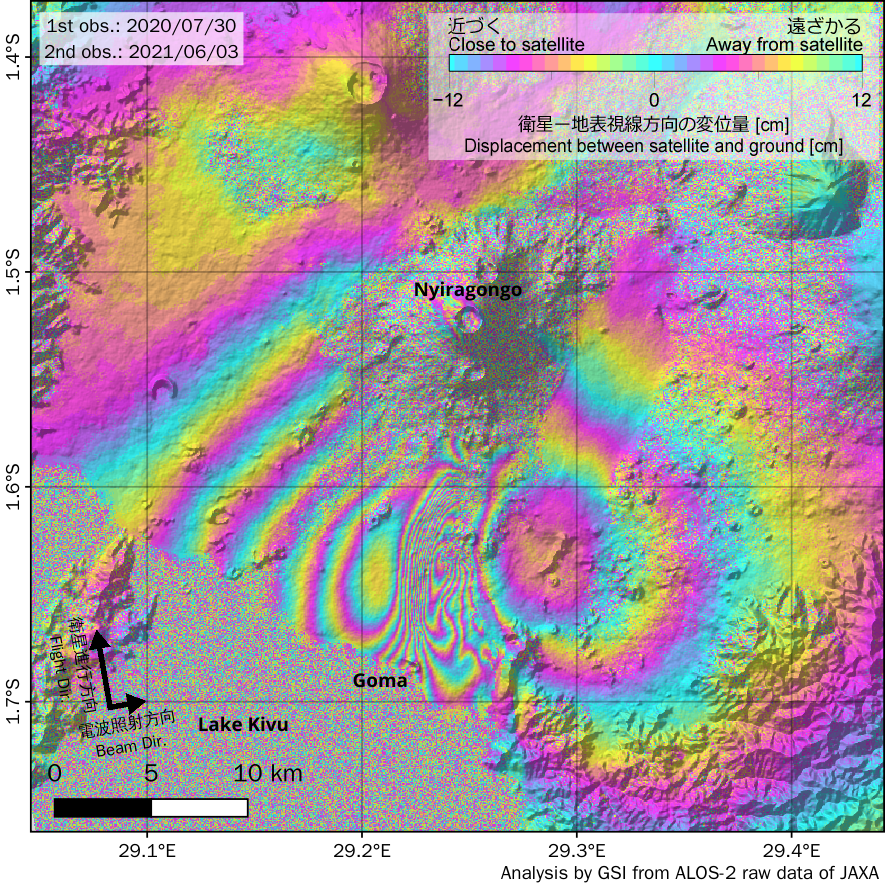
Fig. 6 SAR interferogram (2020-07-30/2021-06-03) [PNG: 1.73MB] 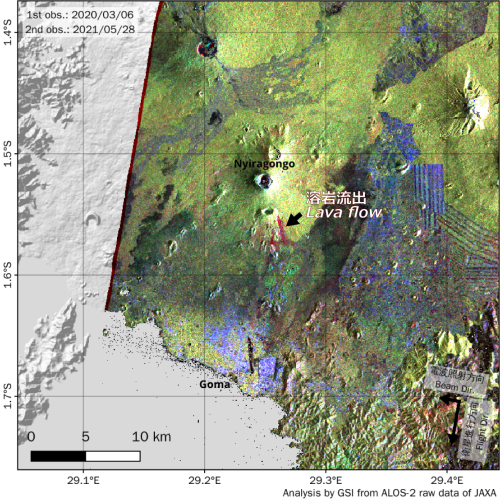
Fig. 7 RGB(*2) composite image (2020-03-08/2021-05-28) [PNG: 2.89MB] 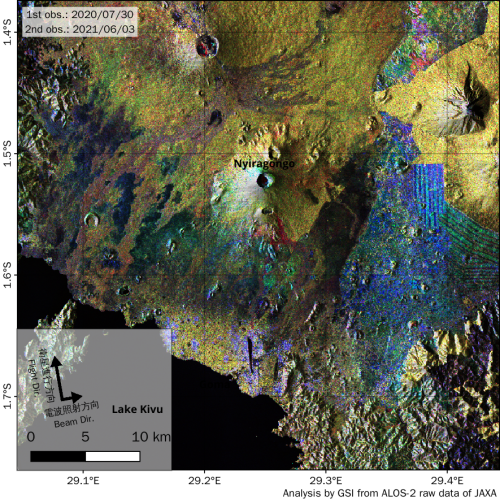
Fig. 8 RGB(*2) composite image (2020-07-30/2021-06-03) [PNG: 1.84MB] *2 R: HV polarization image of the first observation, G: HV polarization image of the second observation, B: HH polarization image of the second observation
Analysis by GSI from ALOS-2 data of JAXA.
These results were obtained through the activity of the SAR analysis working group of the Coordinating Committee for Prediction of Volcanic Eruption. SatelliteALOS-2 (Advanced Land Observing Satellite 2) launched by Japan Aerospace Exploration Agency on May 24, 2014
Copyrights and CreditsCopyright. Geospatial Information Authority of Japan. ALL RIGHTS RESERVED.
We welcome links from your website to this website. When using materials on this website, we ask that proper credit be given. ContactGeography and Crustal Dynamics Research Center
Crustal Deformation Research MUNEKANE Hiroshi: Head of Division Space Geodesy Research KOBAYASHI Tomokazu: Head of Division 
|