

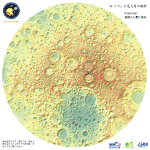
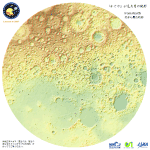
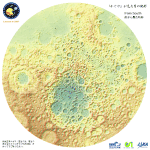
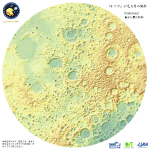
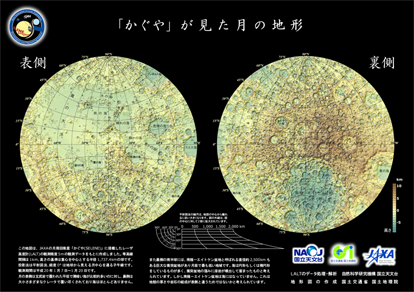
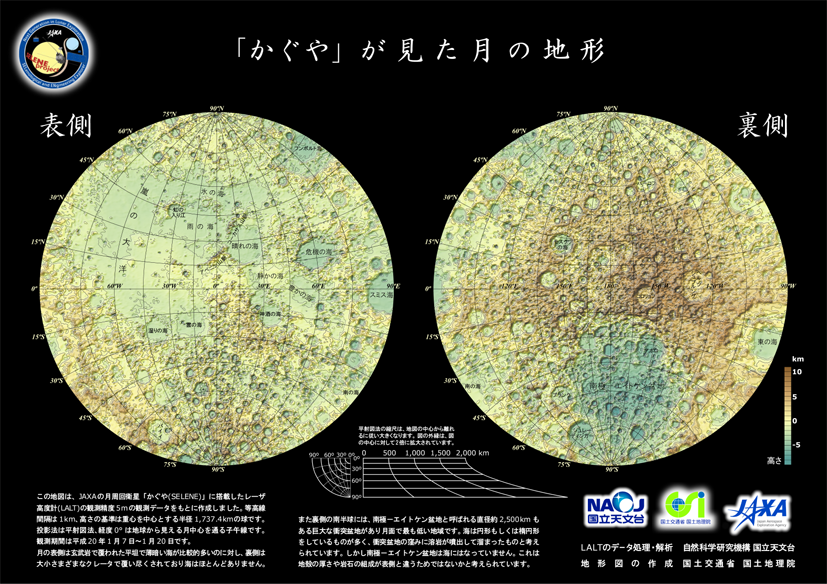
Topographic maps of the moon

Geospatial Information Authority of Japan
Japan Aerospace Exploration Agency
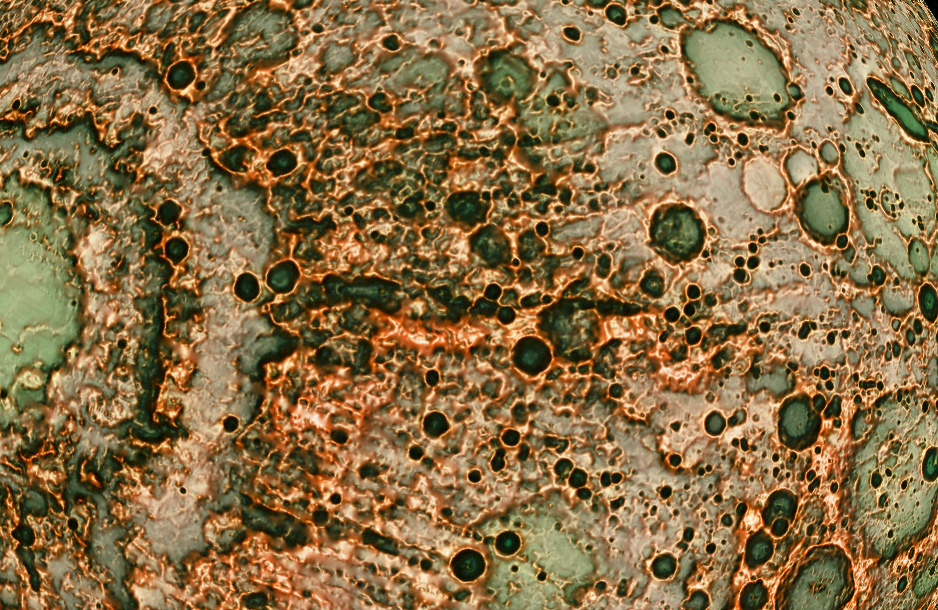
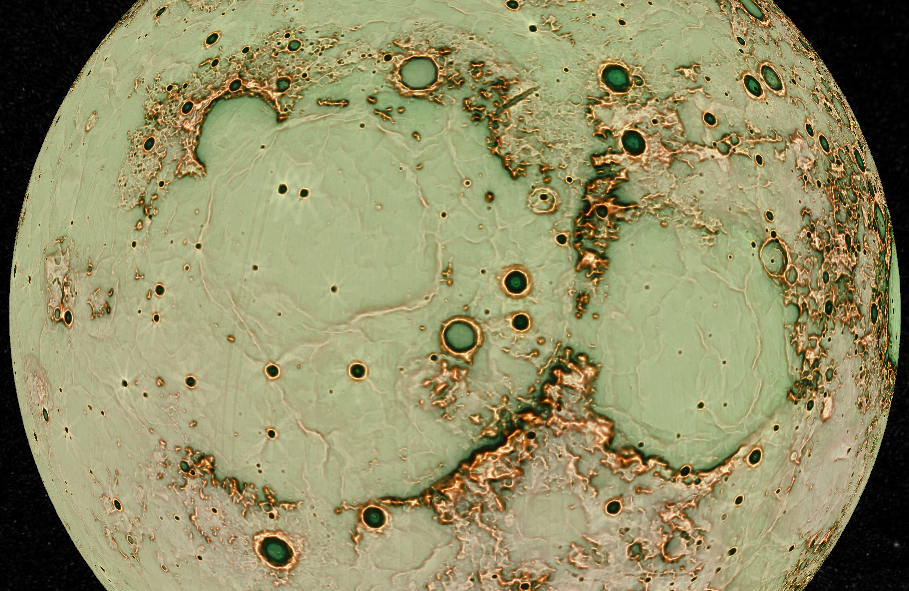
Red relief image maps
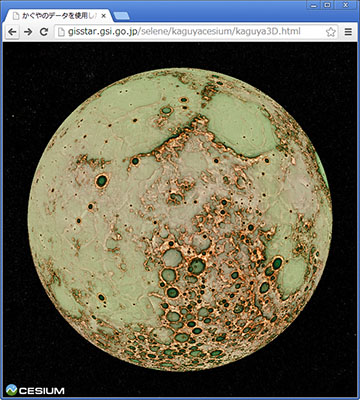
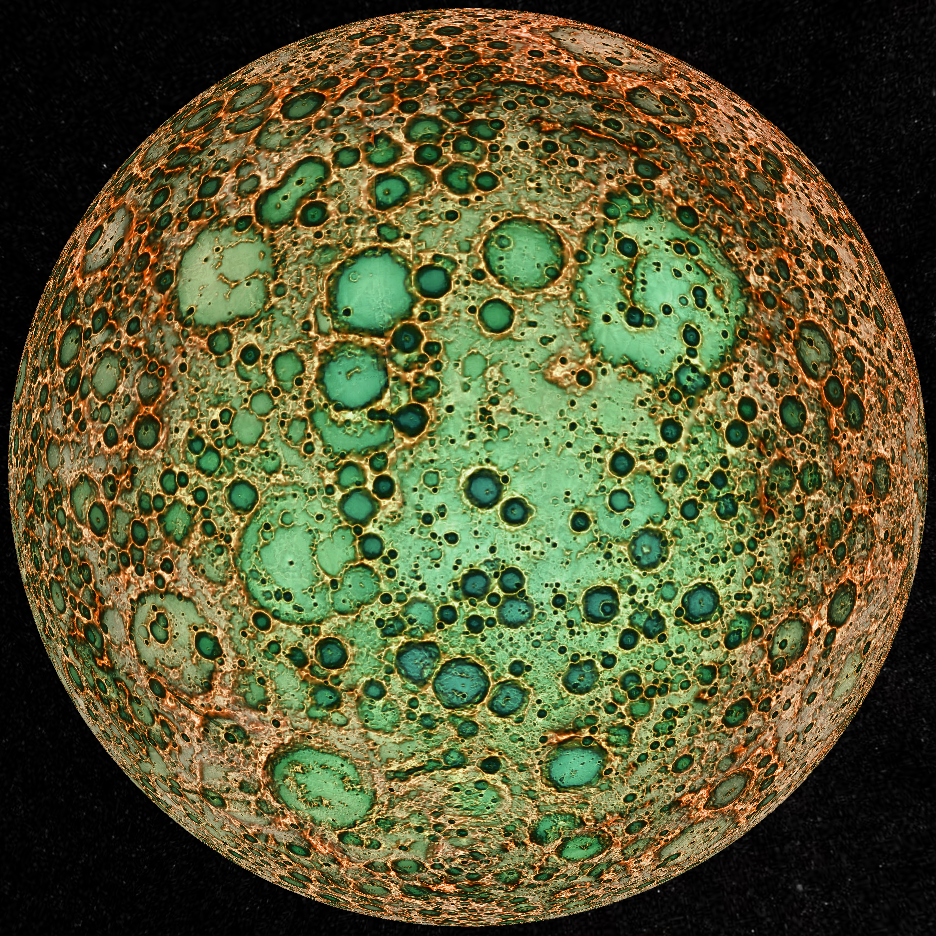
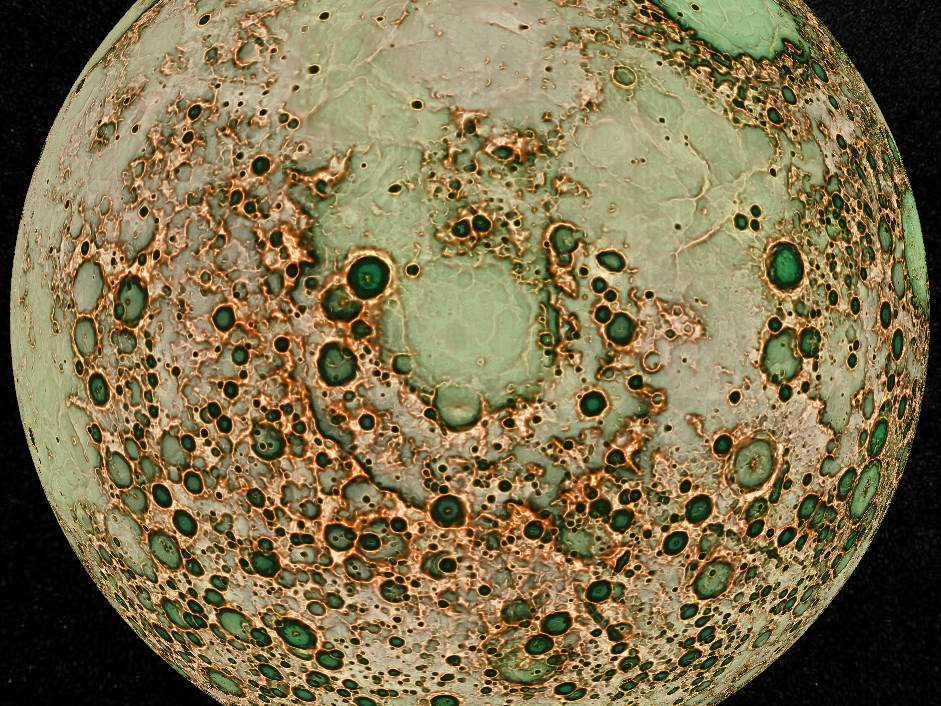
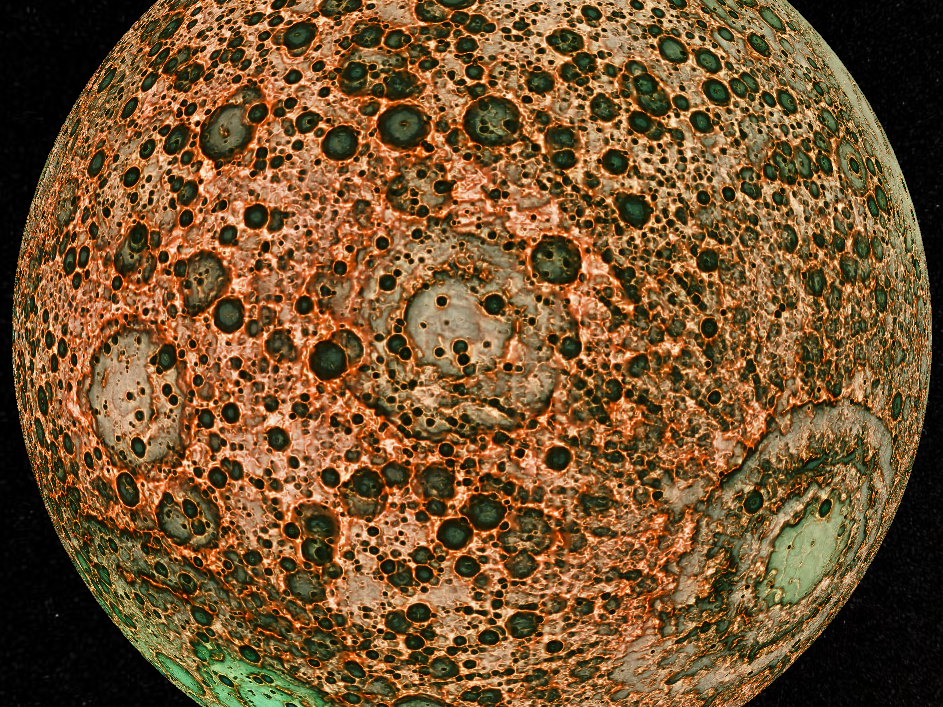
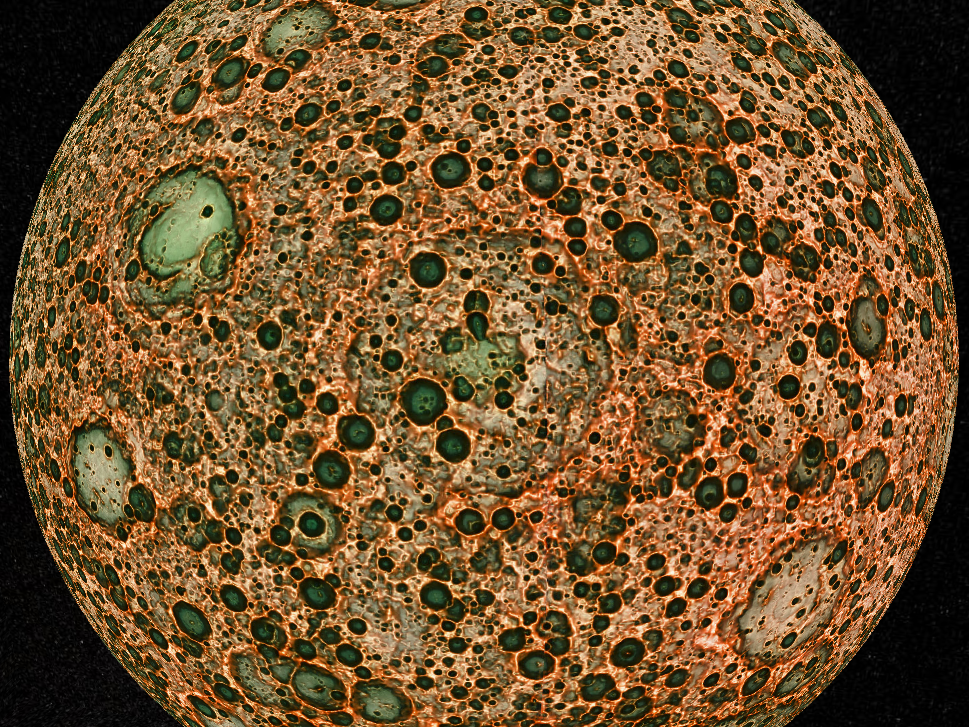
The maps published here (red relief image maps) have been produced by Mr. Tatsuro Chiba from Asia Air Survey, using a method of a red relief image map he developed, as part of the research into map presentation conducted by Geospatial Information Authority of Japan (GSI).
For information regarding red relief image maps, please visit the website of Asia Air Survey .
(a) Freely rotatable red relief image maps of the moon globe
On Windows (requiring Windows 7 or above), please use Firefox. In some cases, the maps may not function due to hardware environment, etc.
 KMZ (compressed KML) (24MB) About Cesium |
 |
|
 |
||
(b) Still images and freely rotatable bird's-eye views
In order to browse the bird's-eye views, please use IE11, Google Chrome or Firefox on Windows (requiring Windows 7 or above), or Safari or Firefox on Mac. In some cases, the maps may not function due to hardware environment, etc. Bird's-eye views are highlighted in the direction of elevation.
 Its bird's-eye view |
 Its bird's-eye view |
 Its bird's-eye view |
 Its bird's-eye view |
 Its bird's-eye view |
 Its bird's-eye view |
 Its bird's-eye view enlarged view of Sinus Iridum |
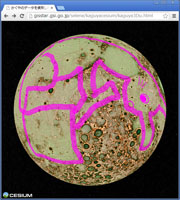
Geographical names dose not indicate the whole or main part of the said still images, but show the central area typically. |  |
With regards to red relief image maps, we have received the following comments from Dr. Hiroshi Araki of the National Astronomical Observatory of Japan, who was the project leader on KAGUYA's LALT that acquired the original data on which the maps published here are based.
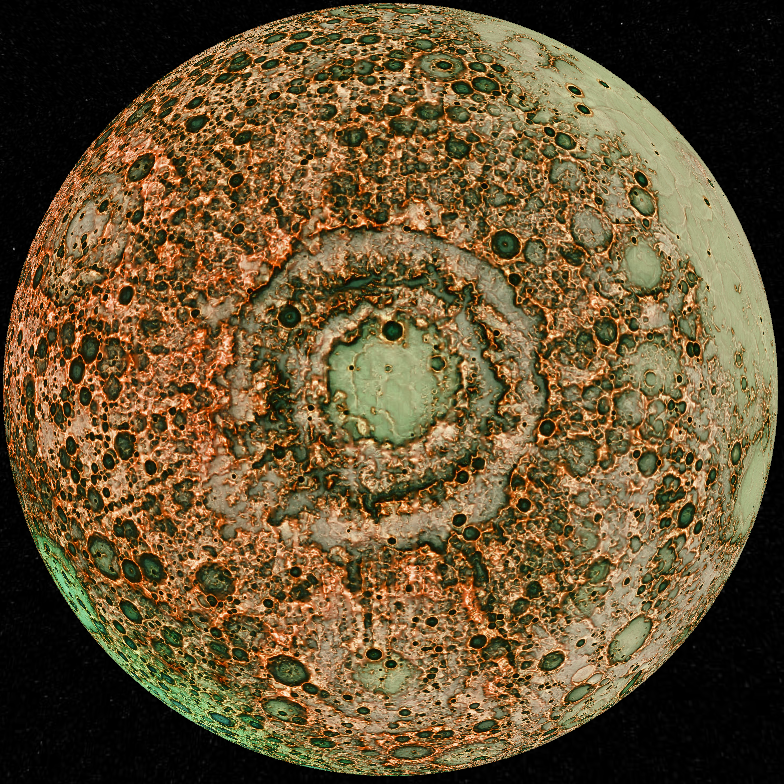
Using red relief image maps, we can clearly confirm overlapping lunar craters and complex structure of lava layers in the lunar maria. Their topographic decipherability is greatly improved compared with the traditional maps. Thanks to recent lunar explorations such as KAGUYA and LRO (a lunar orbiting probe launched by NASA), global and accurate lunar topographic data with 10m or less horizontal resolution have become accessible for the last several years. Such high-resolution data with the red relief image map will be helpful for the systematic search and confirmation of new topographic features, which may lead to a great impact on the understanding of the formation history of lunar topography.
The person wanting the bird's-eye view mentioned above, please contact me to gsi-gia+1=gxb.mlit.go.jp. Please change = of gsi-gia+1=gxb.mlit.go.jp into @.
1. Introduction
2. Topographic maps of the moon
These topographic maps of the moon were produced using data covering a period of two weeks. The layout fits the A3 size.
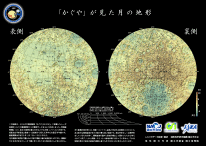
*1 The stereographic projection and the Mercator projection are the conformal projection (in which angles are correct). In the conformal projection, microscopic circles (in practical terms, circles that are not very large) on the moon's surface appear as circles even in maps. Therefore, craters appear to be round. In the stereographic projection in particular, all circles on the moon's surface appear to be perfectly round even on maps.
*2 The Hammer projection is the projection that has relatively little angular distortion even among equal-area projections (in which the area is correct).
*3 The Equidistant Cylindrical projection is the projection in which the lengths are correct in accordance with the equator and all meridians. Latitude and longitude have been used as coordinates on the maps without modification.
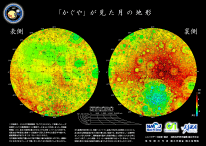
3. Comparison with existing data
For reference, we are also publishing comparisons with topographic maps produced from former data (ULCN 2005) using the same methods. It can be seen that the Laser Altimeter onboard the KAGUYA satellite is capturing detailed topography.
| Original Data |
Outline | Display (gif) |
Download (zipped tiff) |
|---|---|---|---|
| the Laser Altimeter onboard the KAGUYA January 7-20, 2008 (shows again) |
 |
25dpi ( 54KB, 413× 292) 50dpi (184KB, 827× 584) 100dpi (603KB, 1653×1169) 200dpi (1.5MB, 3306×2338) 400dpi (5.9MB, 6613×4676) 800dpi (18.0MB,13225×9350) |
25dpi (174KB, 413× 292) 50dpi (659KB, 827× 584) 100dpi (1.7MB, 1653×1169) 200dpi (4.0MB, 3306×2338) 400dpi (6.0MB, 6613×4676) 800dpi (10.4MB,13225×9350) |
| former data (ULCN 2005) |
 |
25dpi ( 60KB, 413× 292) 50dpi (178KB, 827× 584) 100dpi (509KB, 1653×1169) 200dpi (1.4MB, 3306×2338) 400dpi (2.8MB, 6613×4676) 800dpi (4.8MB,13225×9350) |
25dpi (124KB, 413× 292) 50dpi (366KB, 827× 584) 100dpi (1.0MB, 1653×1169) 200dpi (2.4MB, 3306×2338) 400dpi (4.3MB, 6613×4676) 800dpi (5.4MB,13225×9350) |
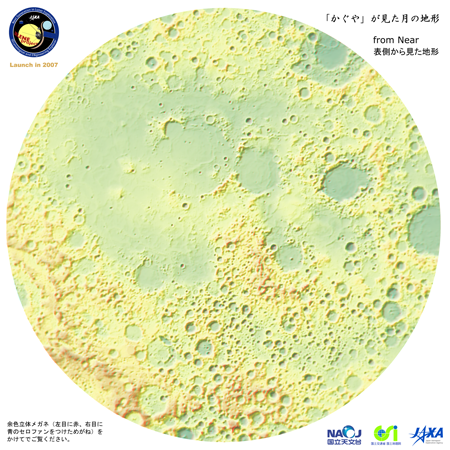
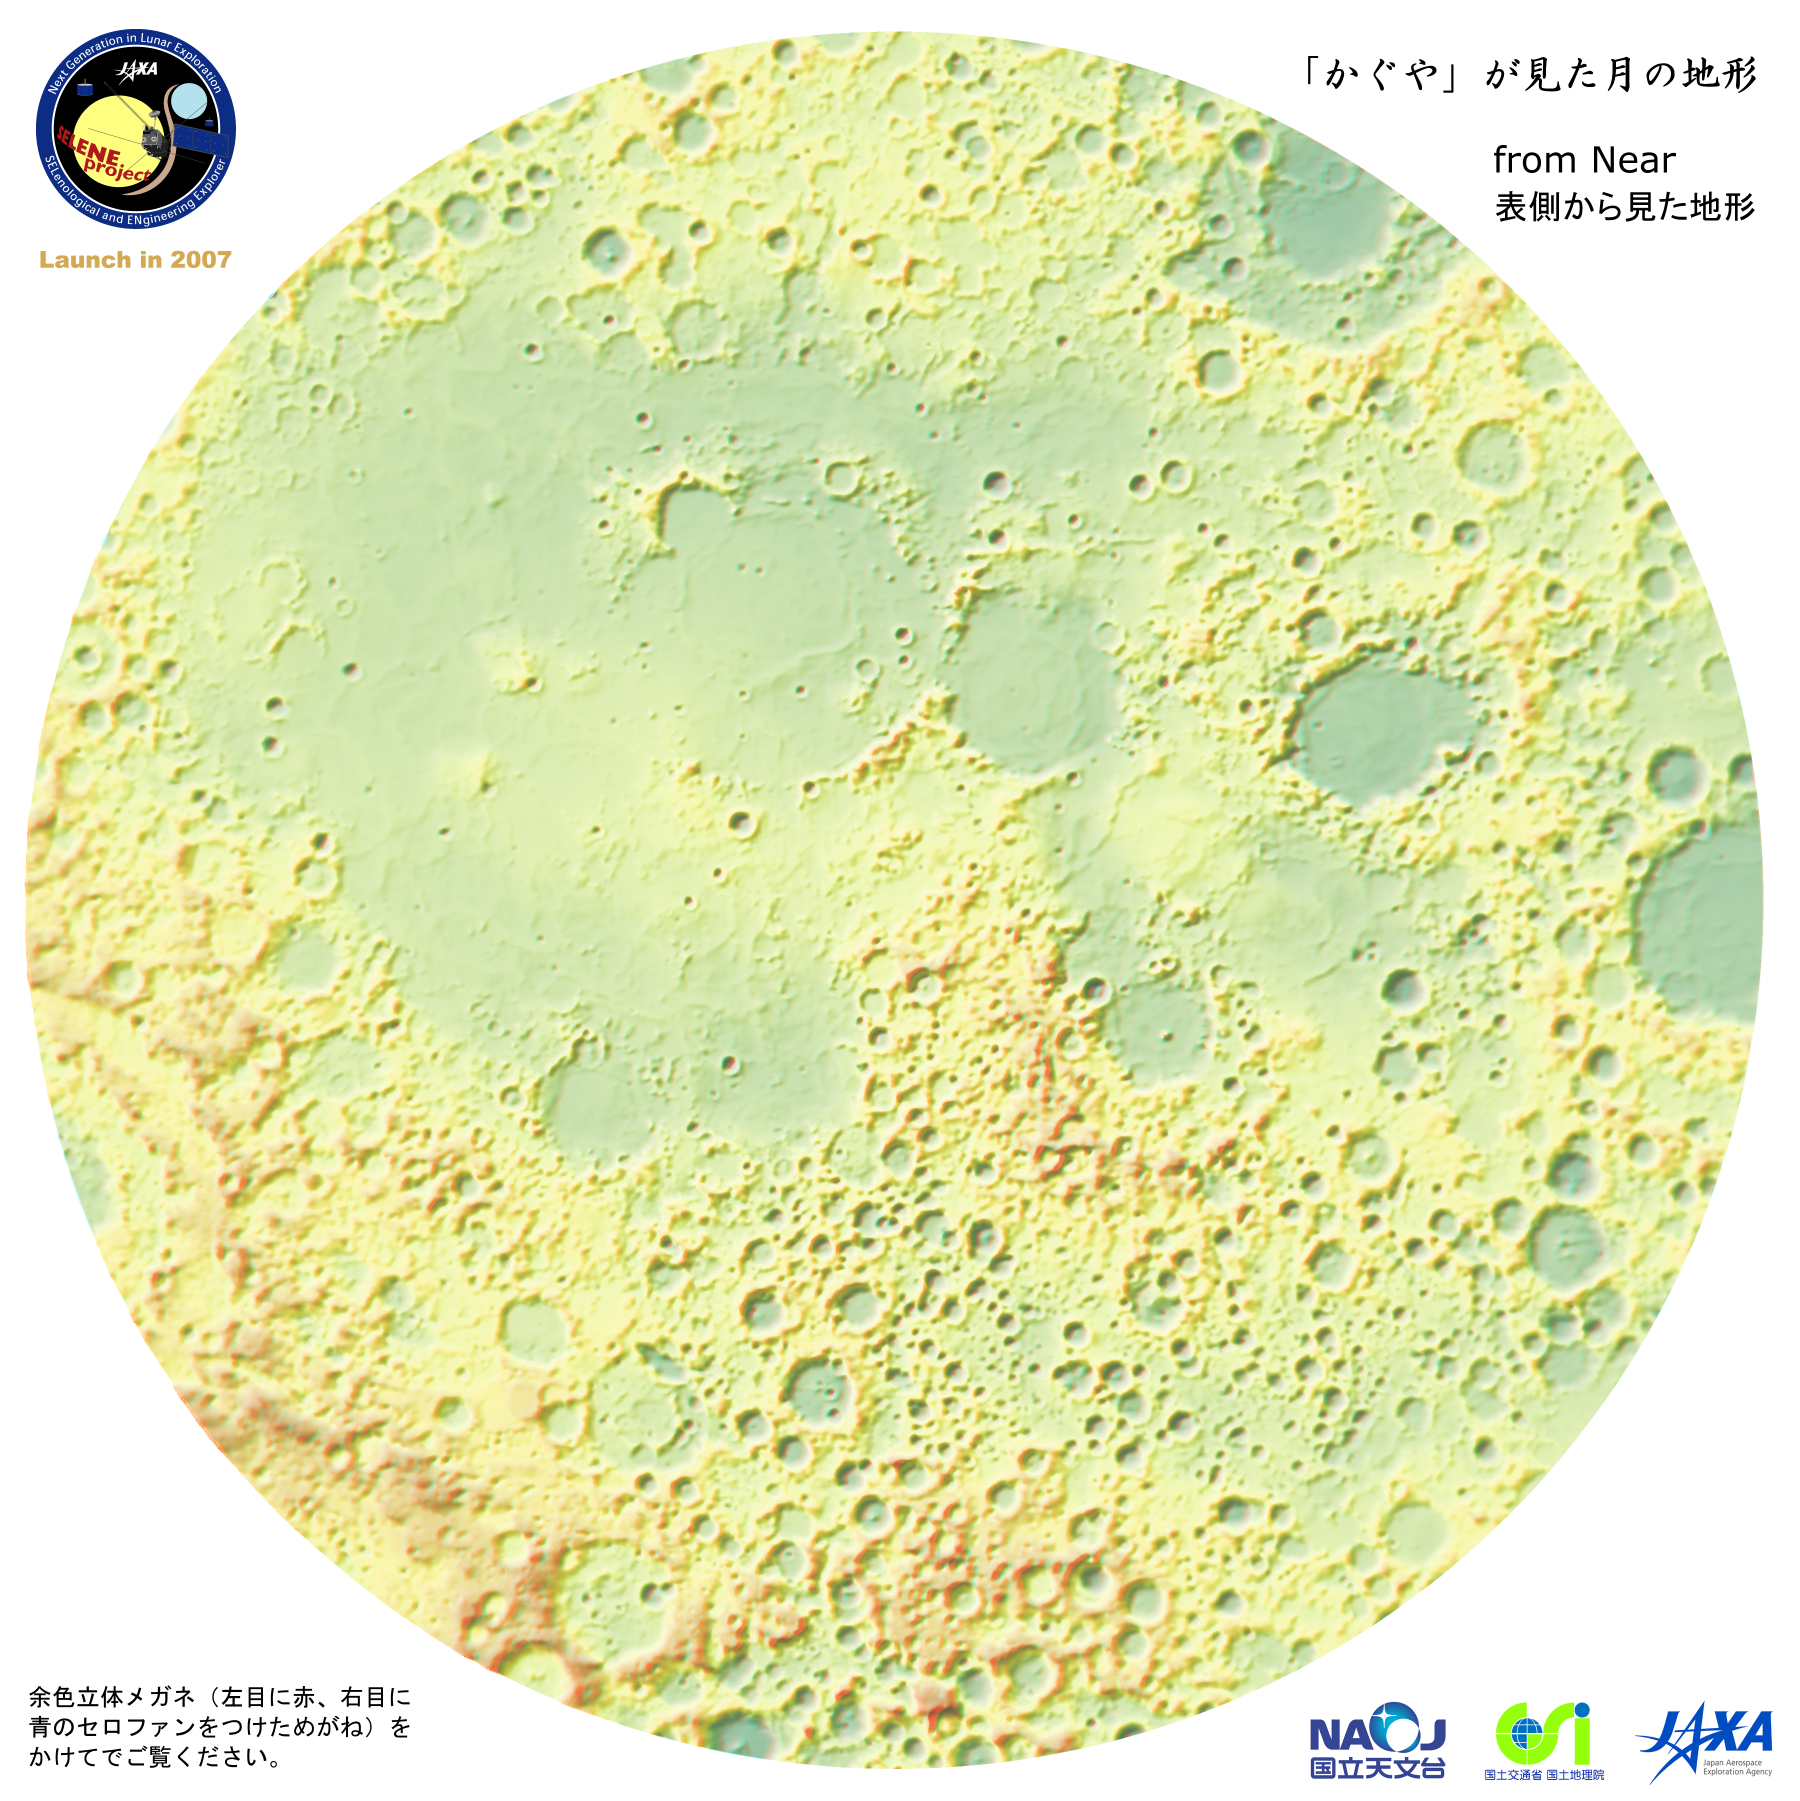
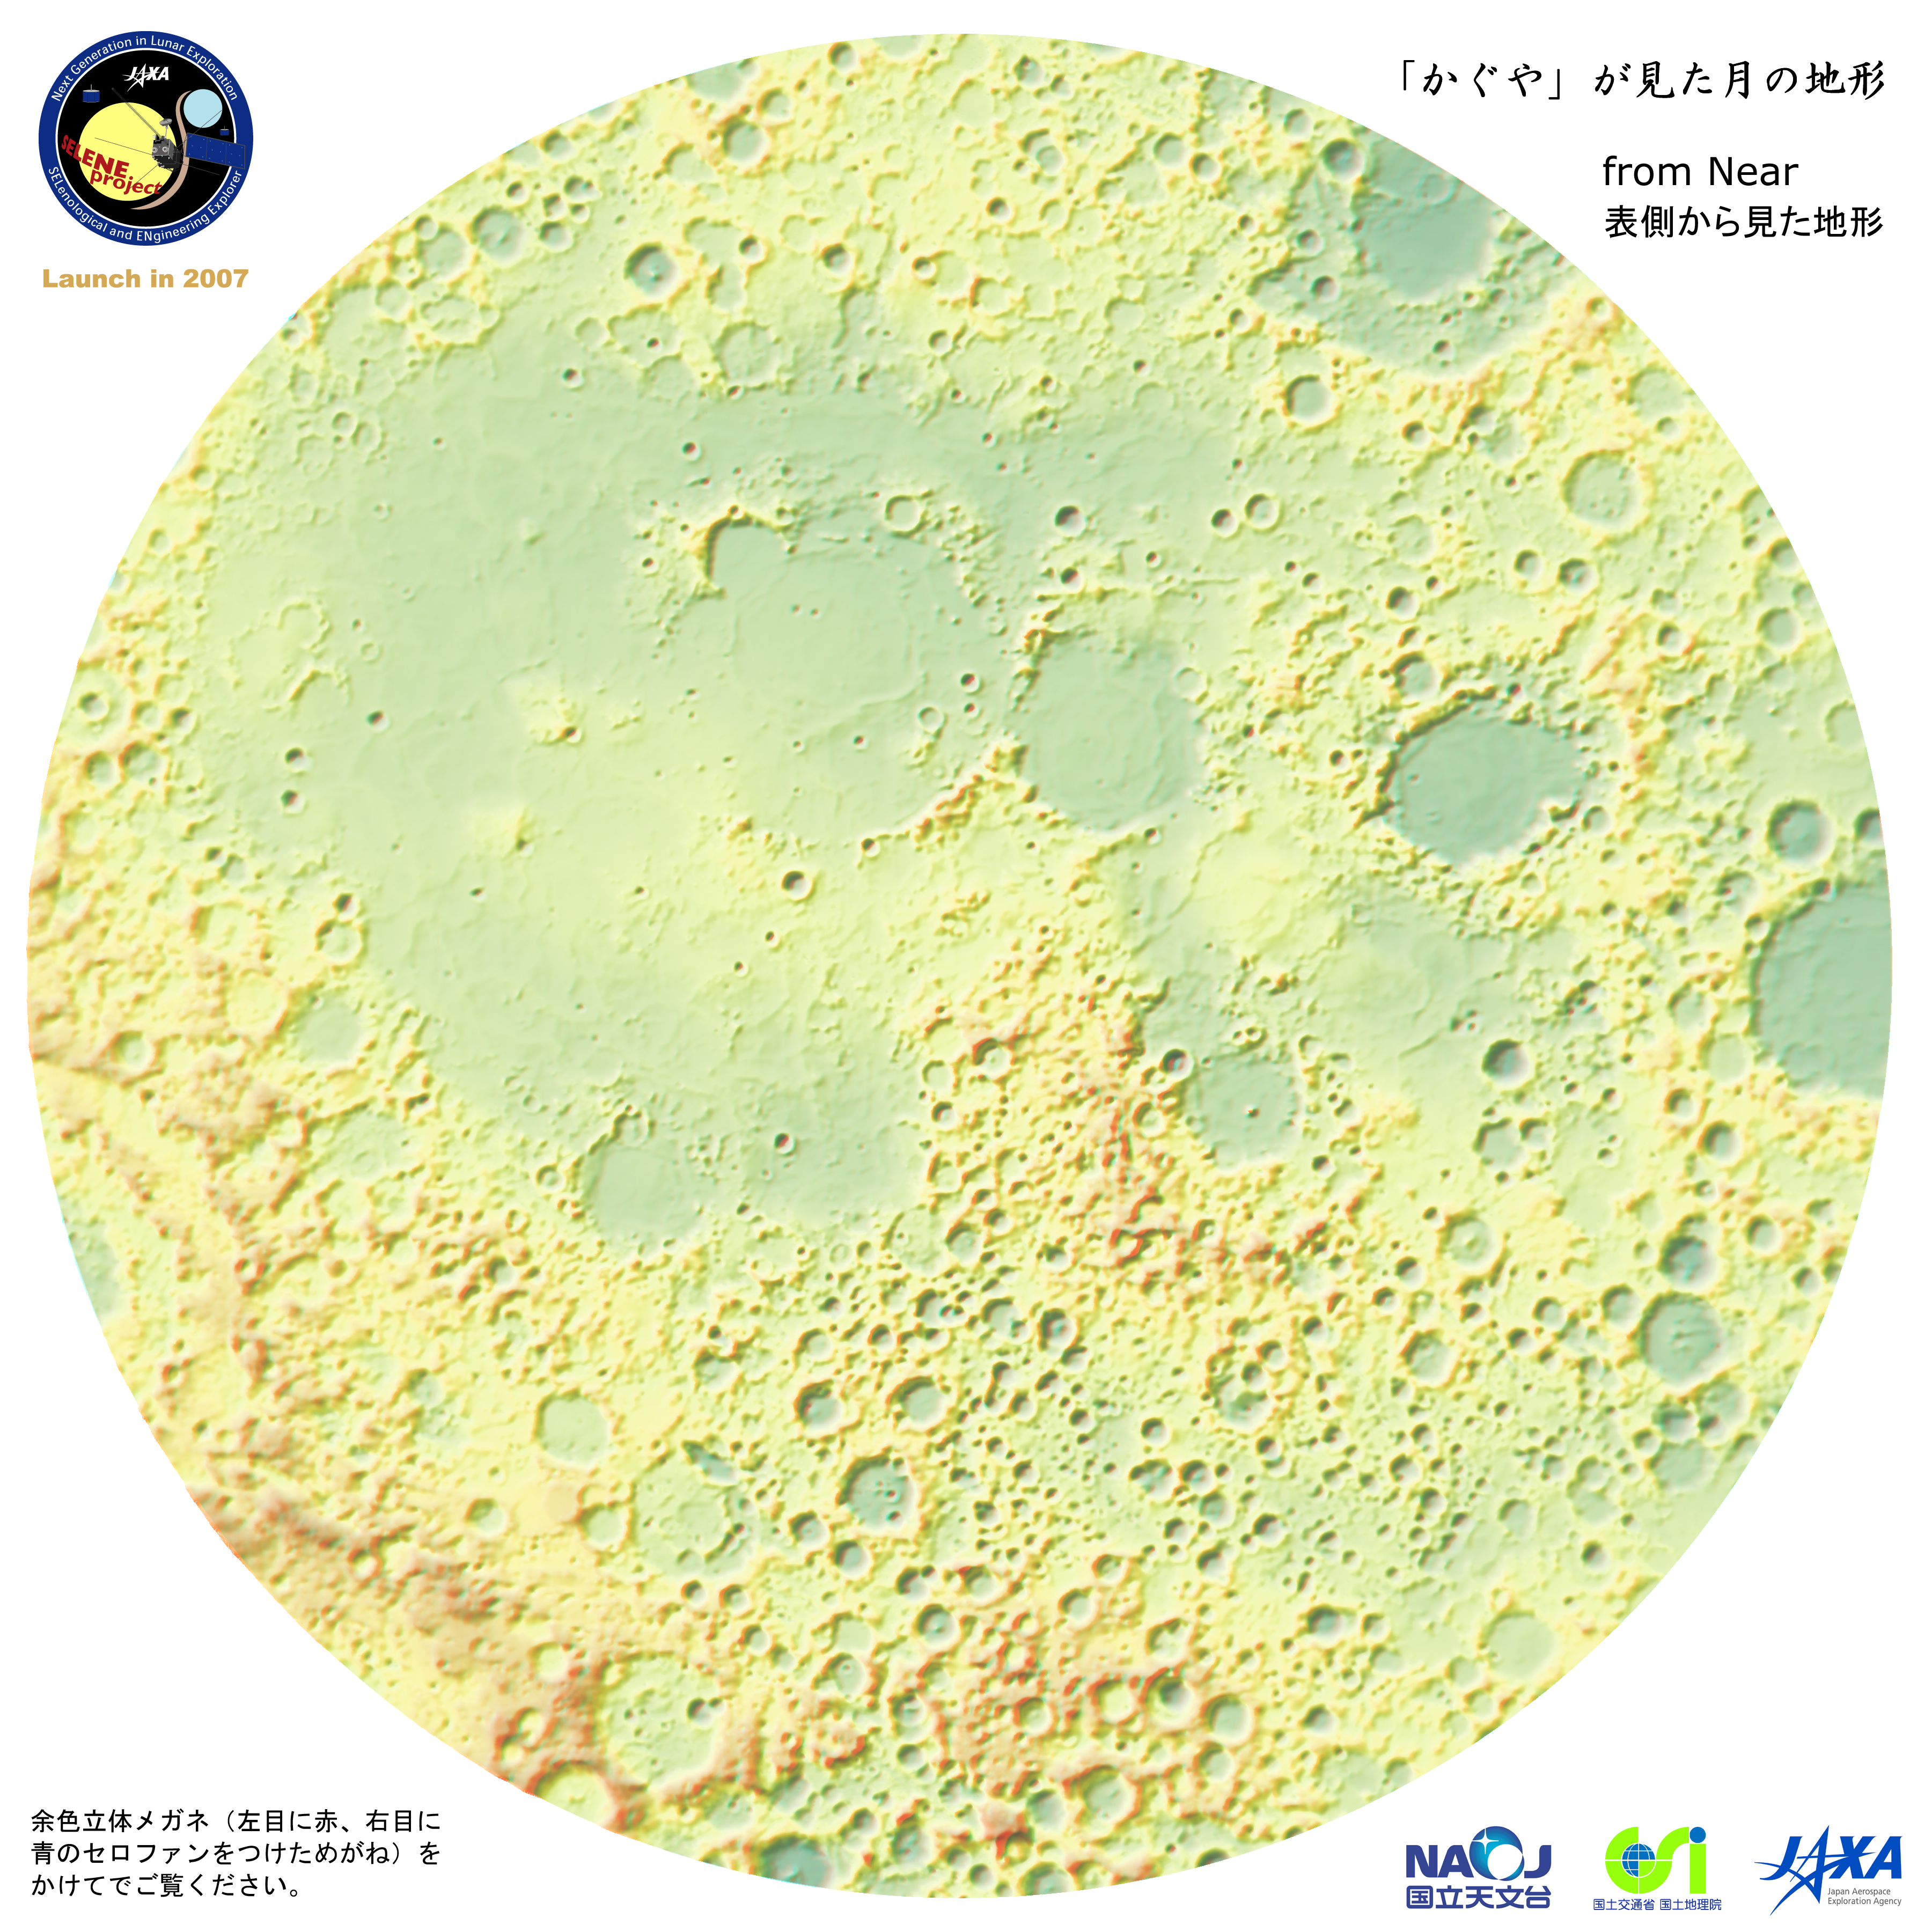
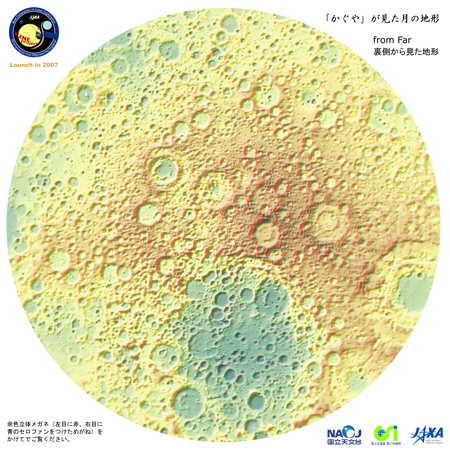
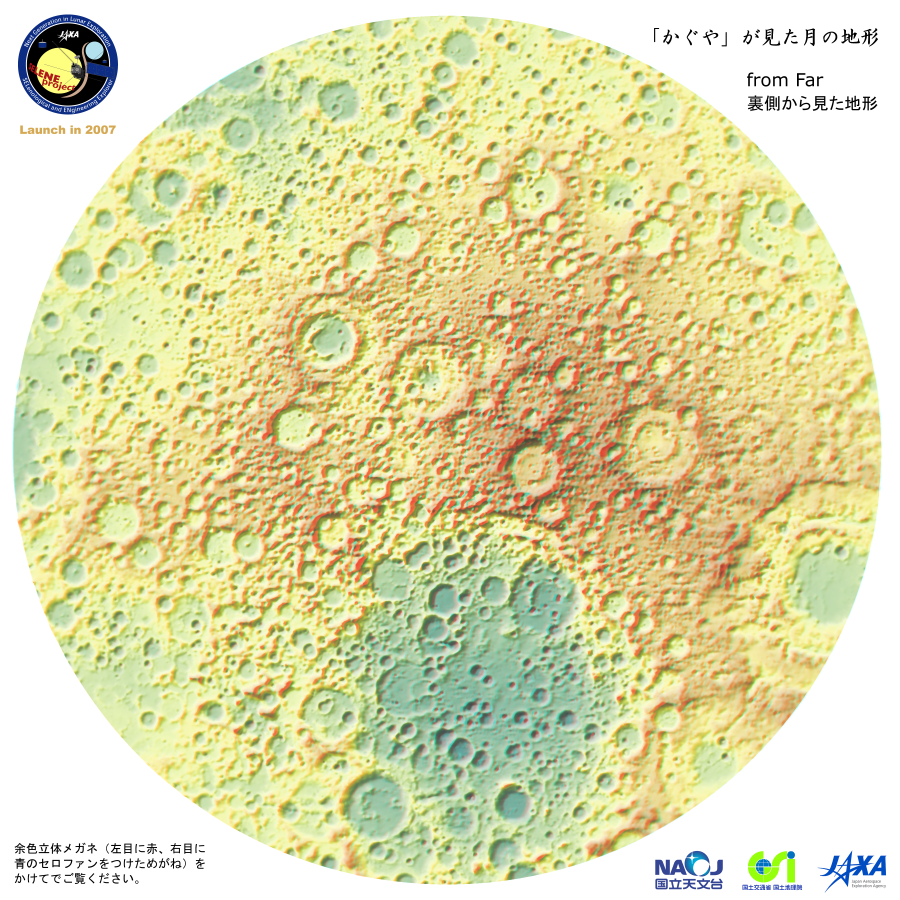
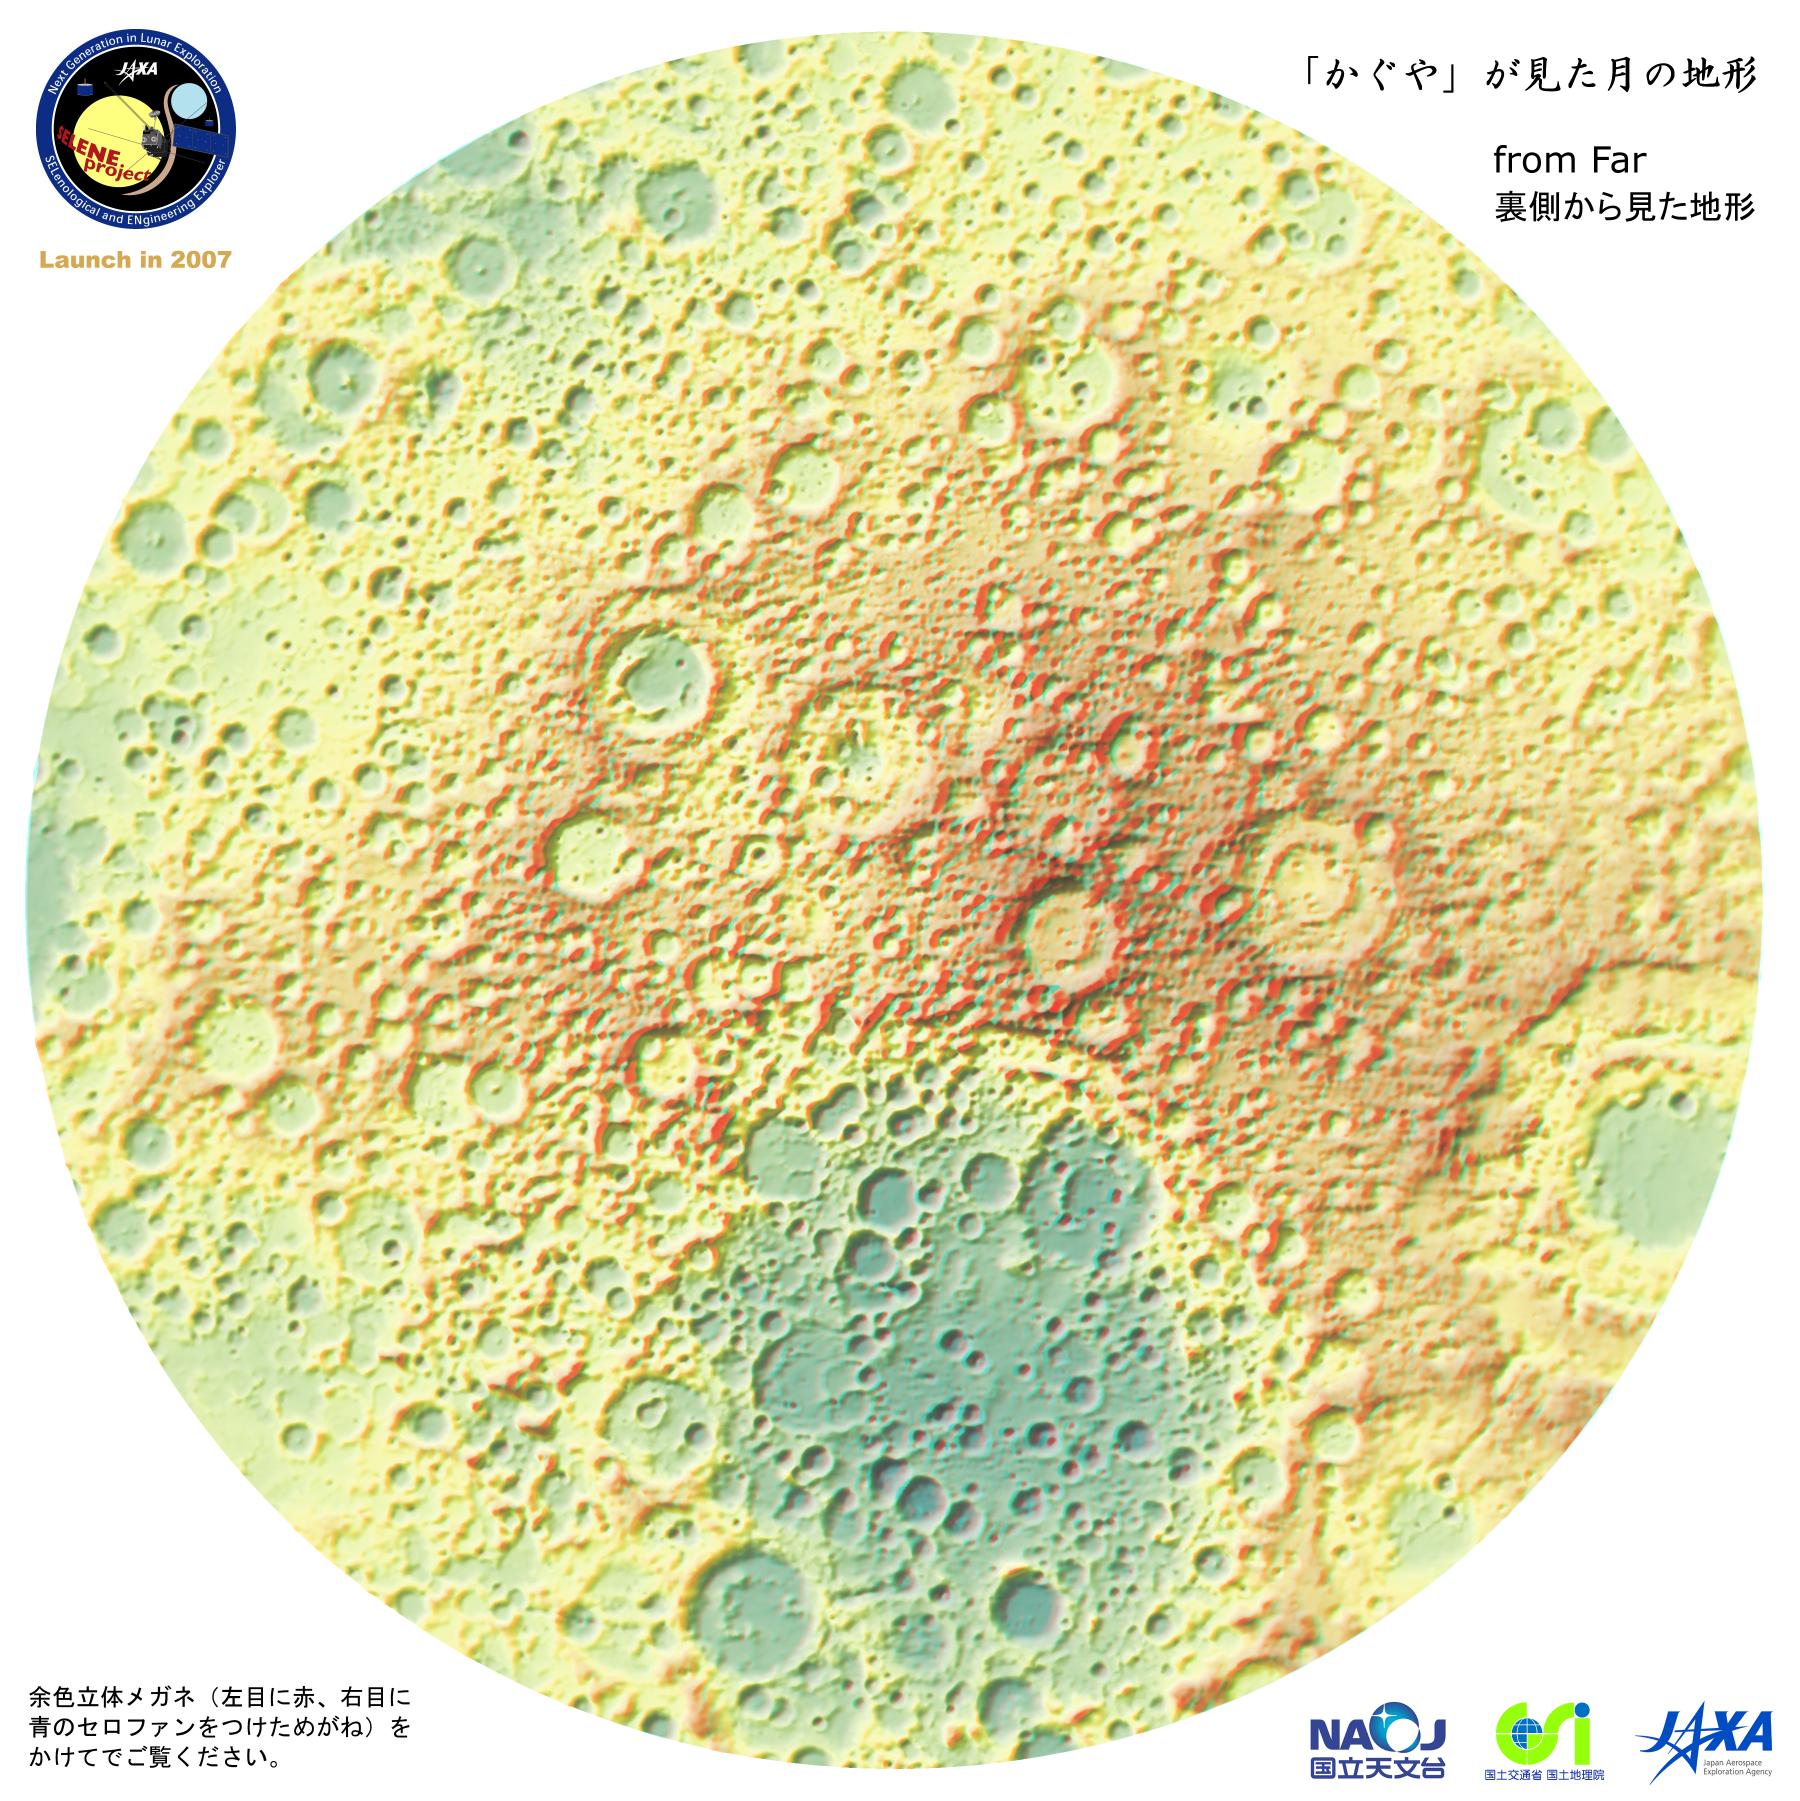
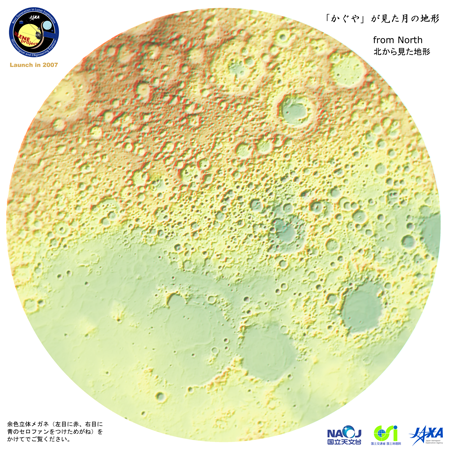
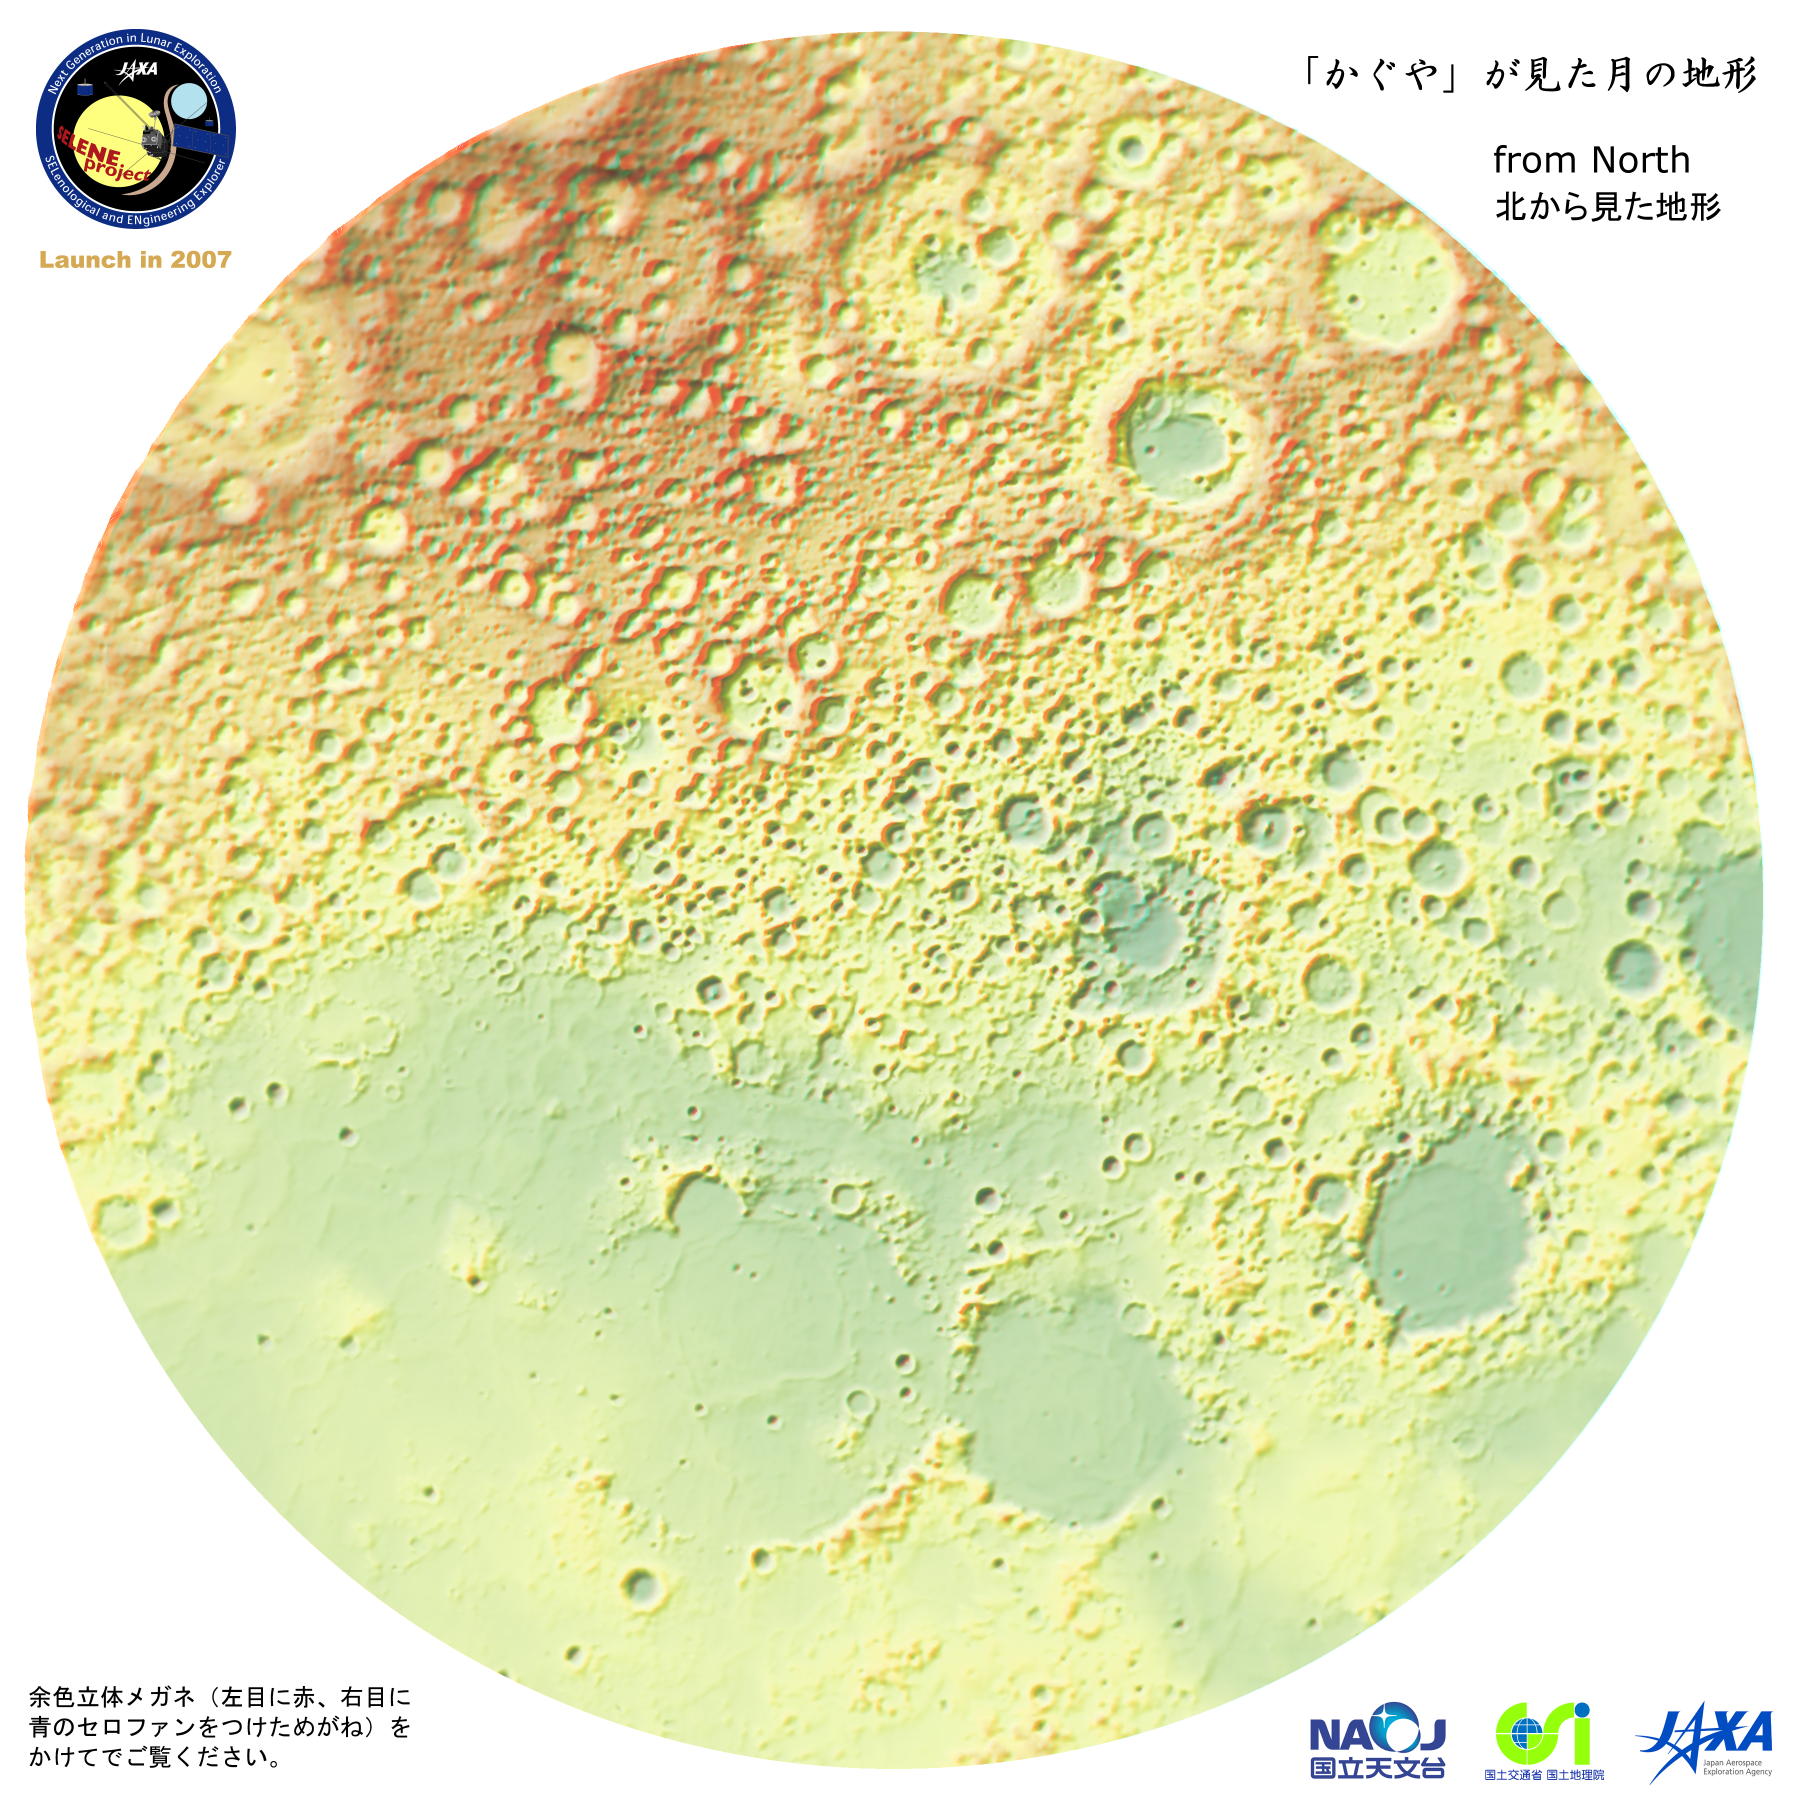
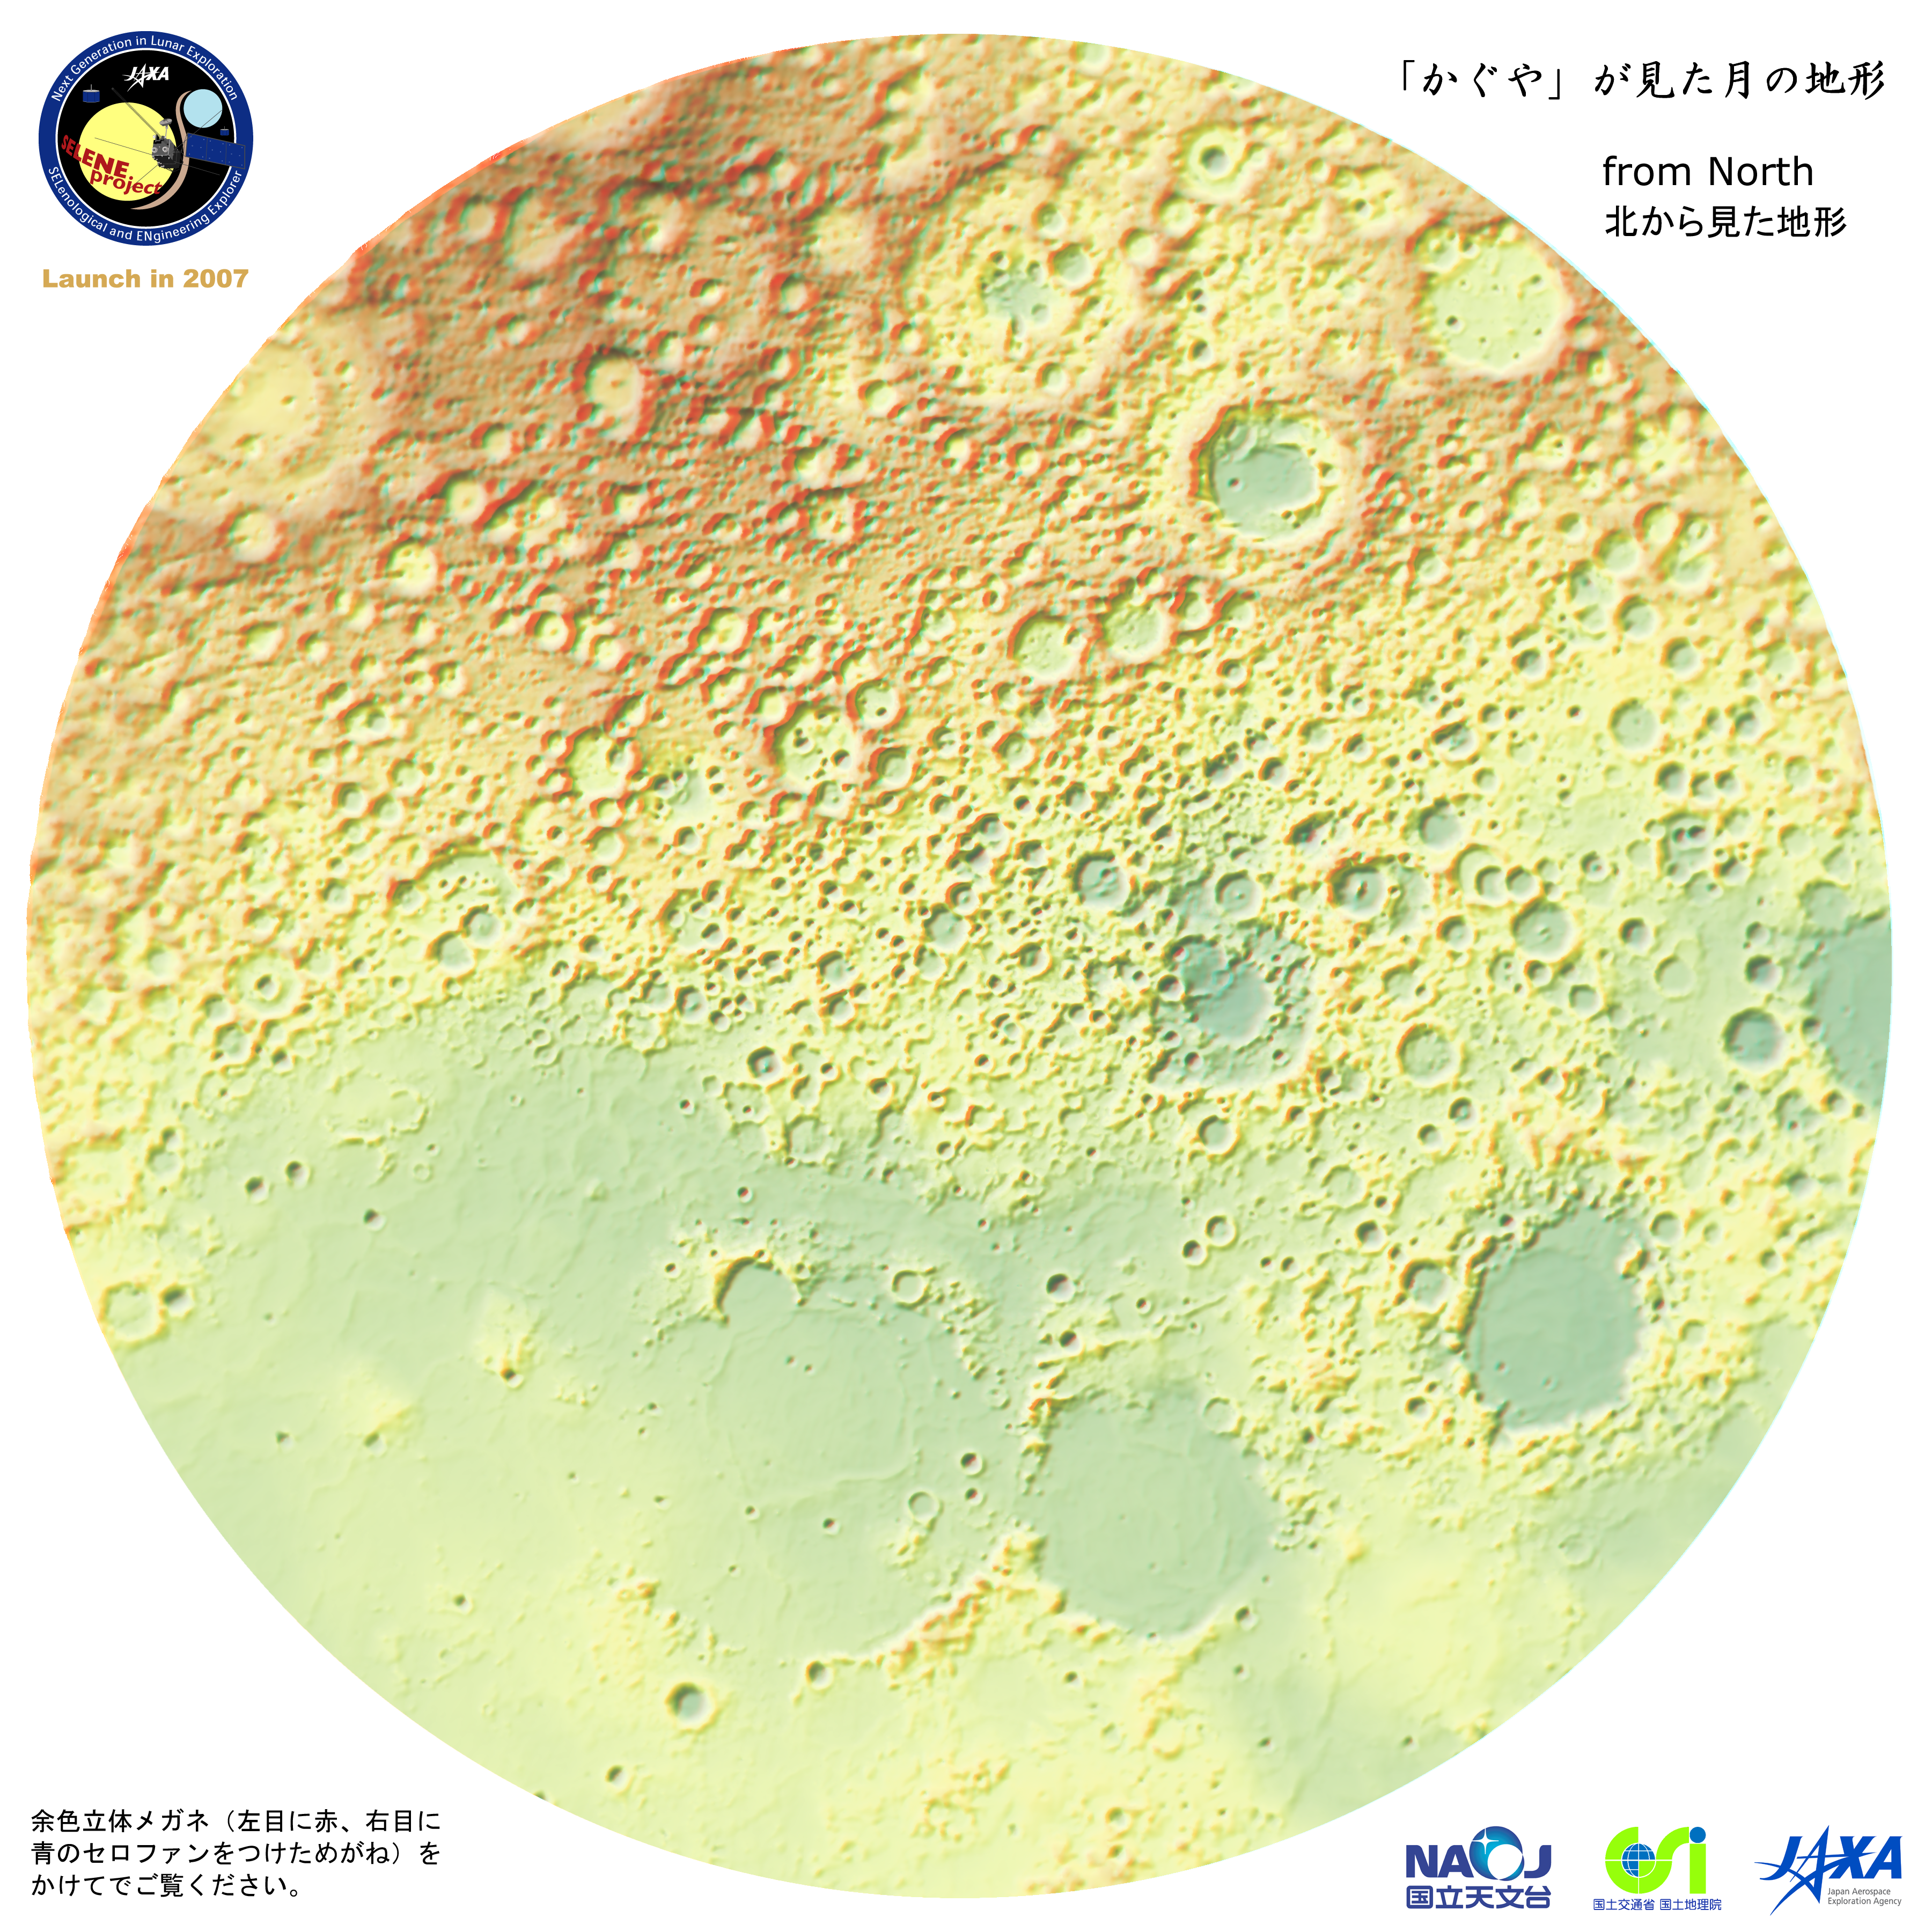
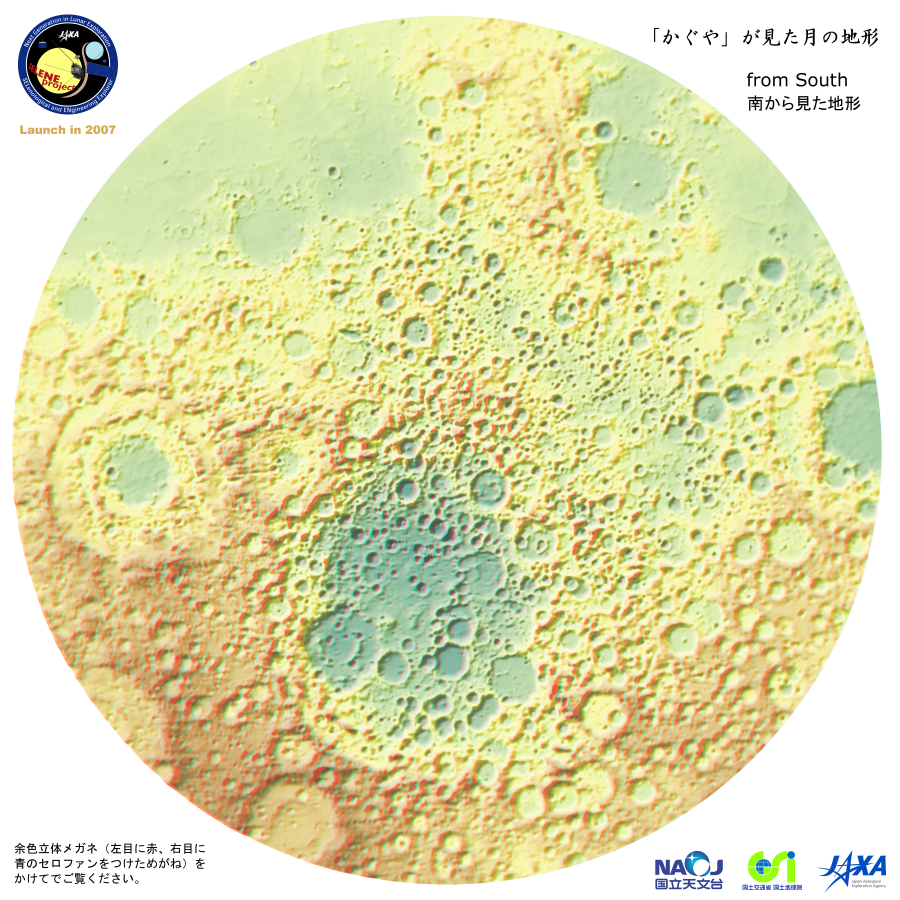
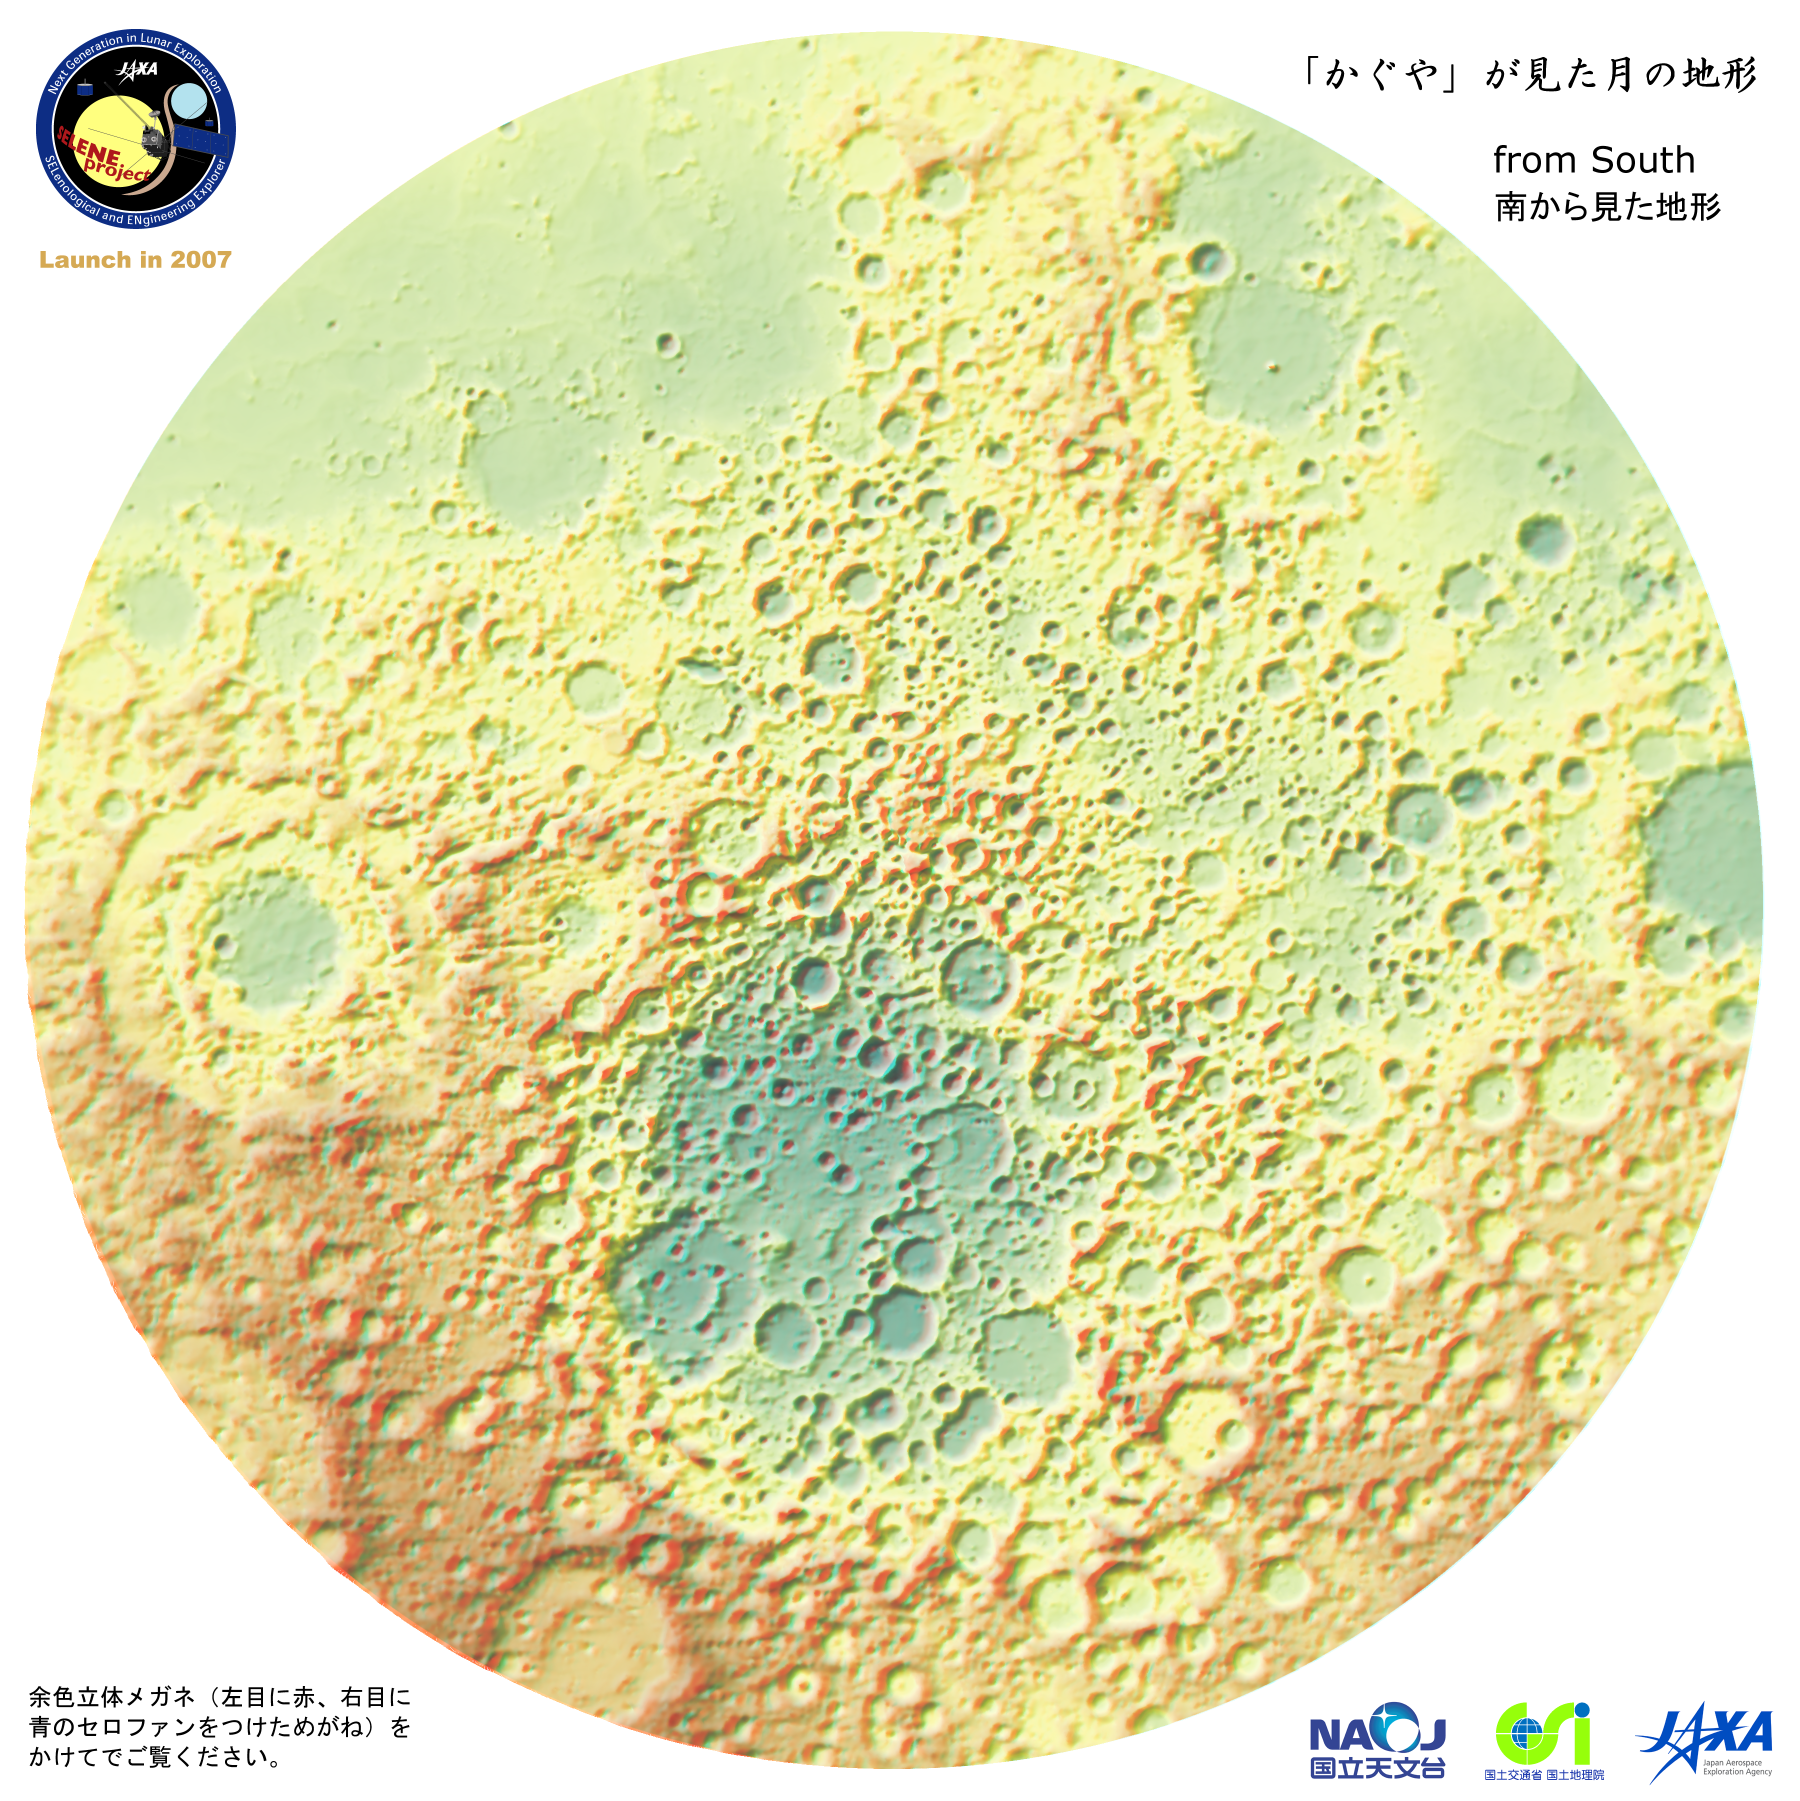
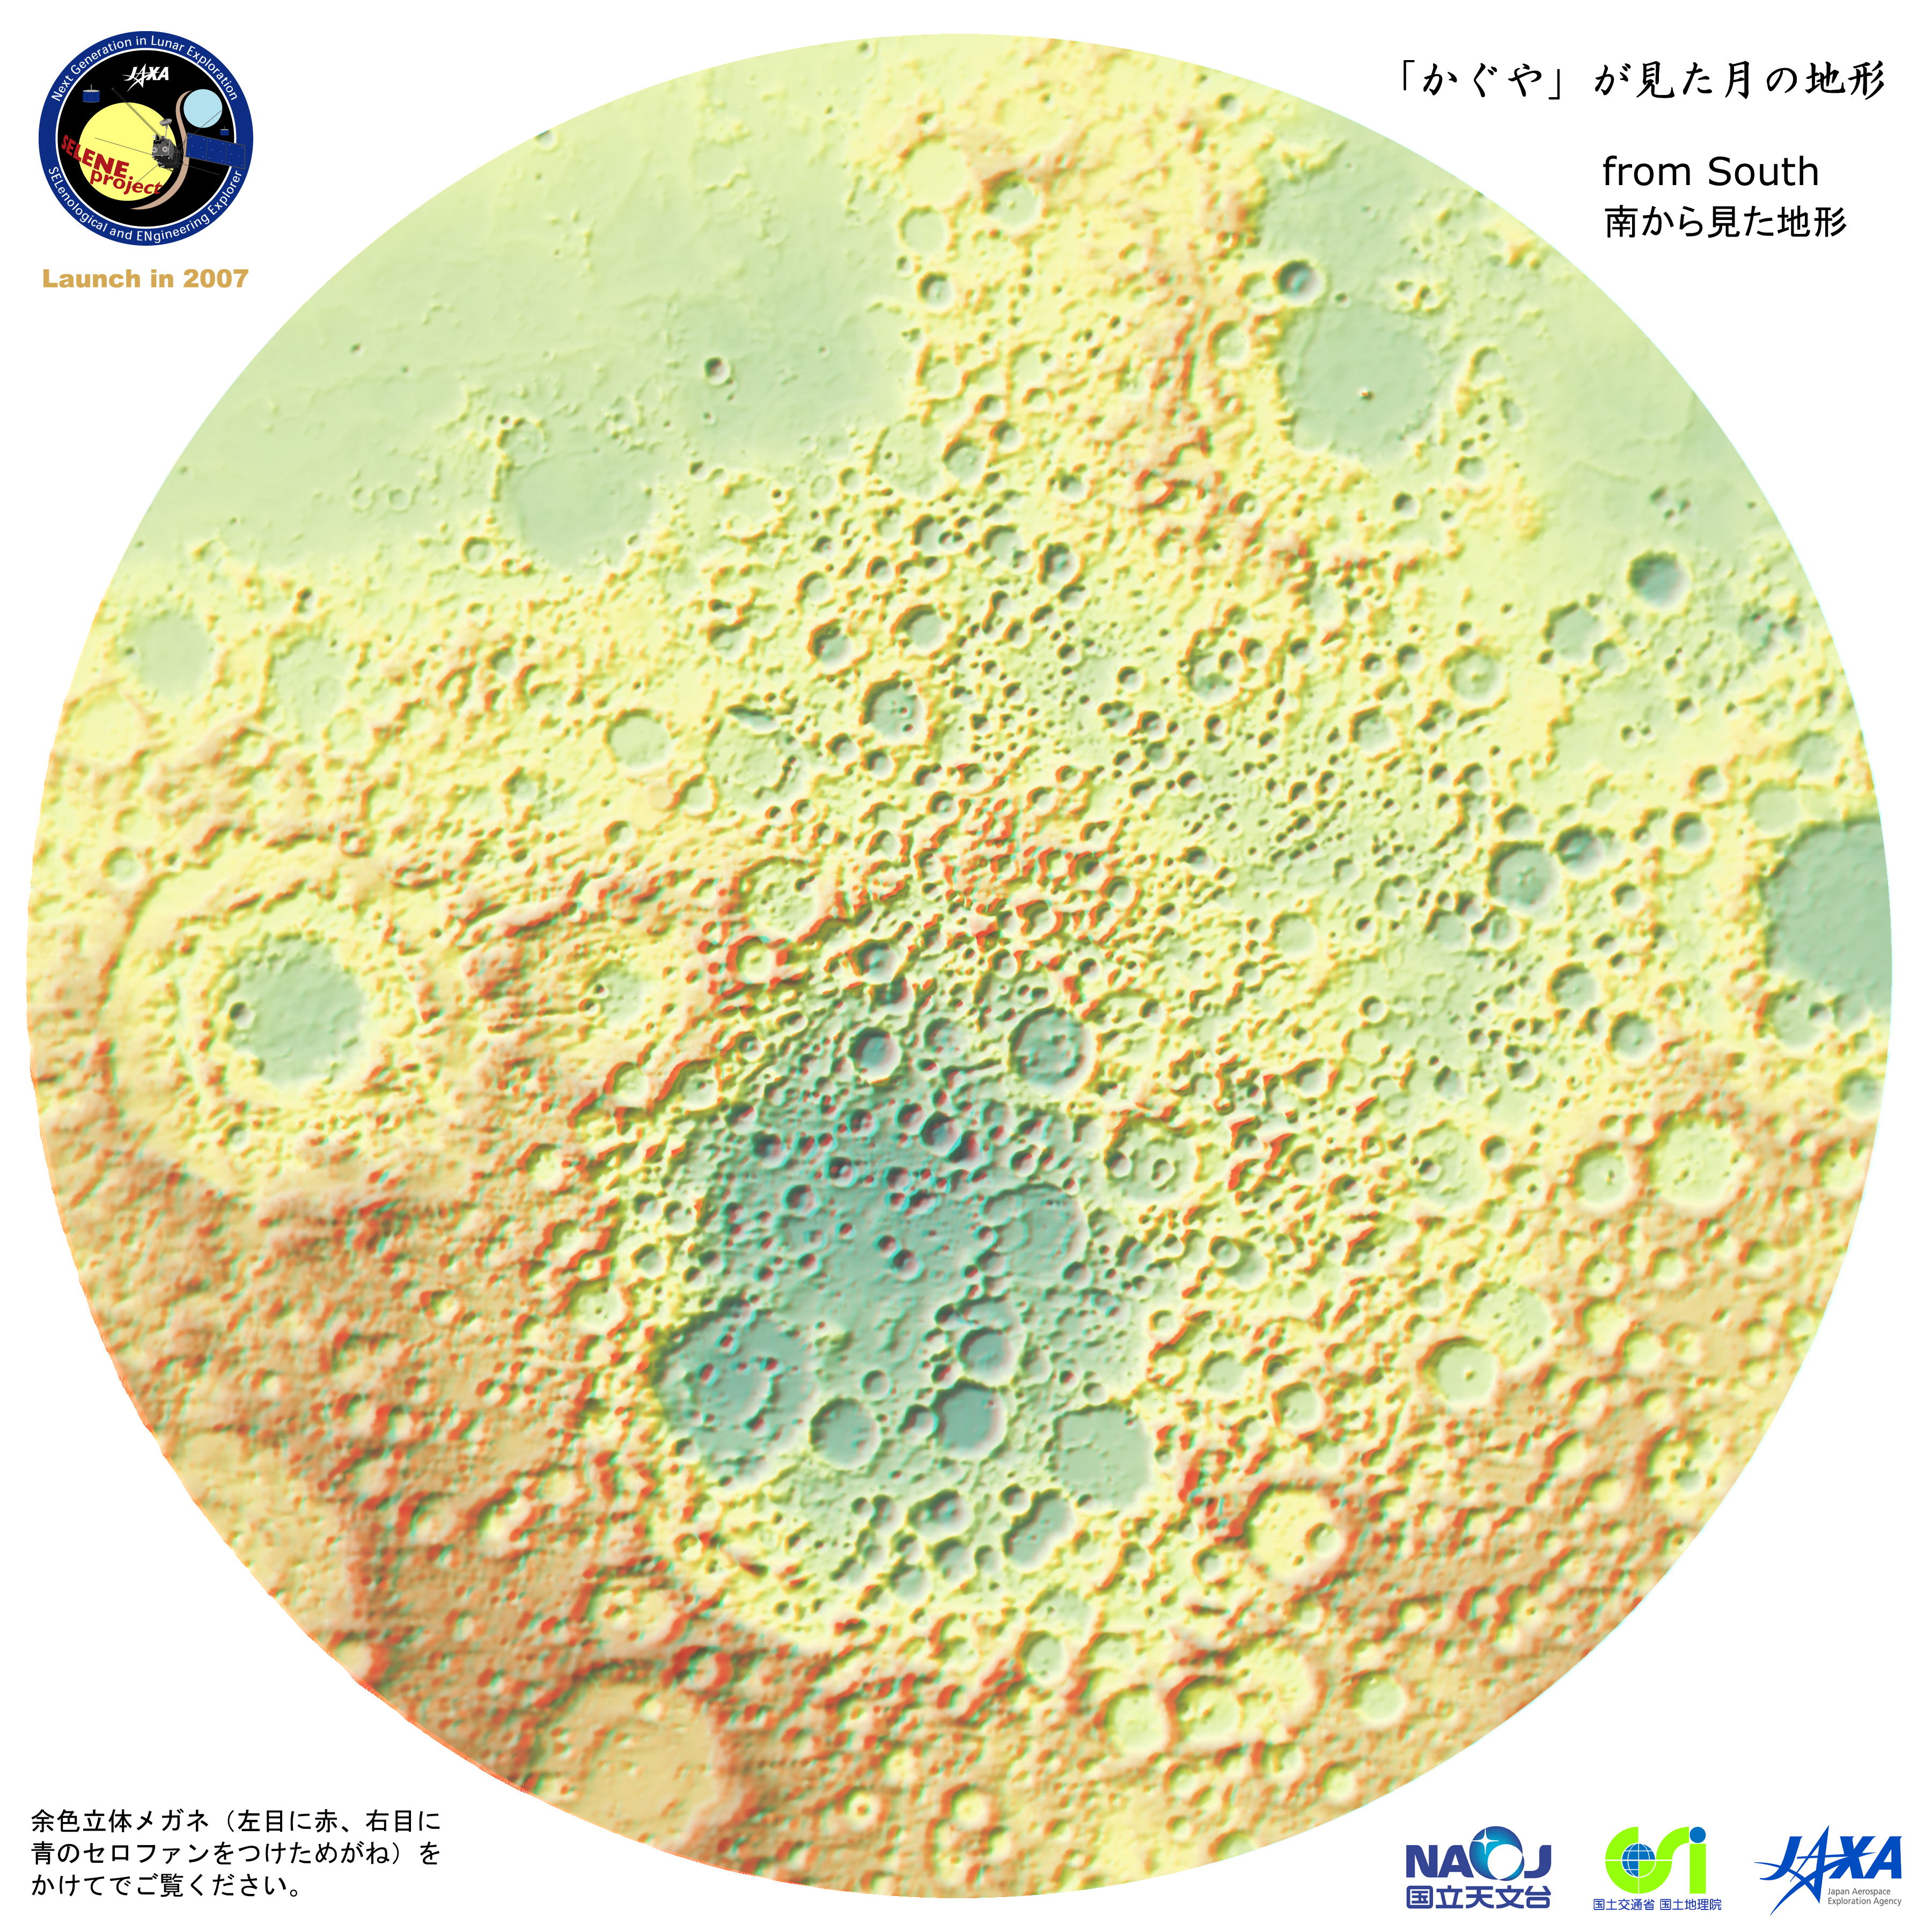
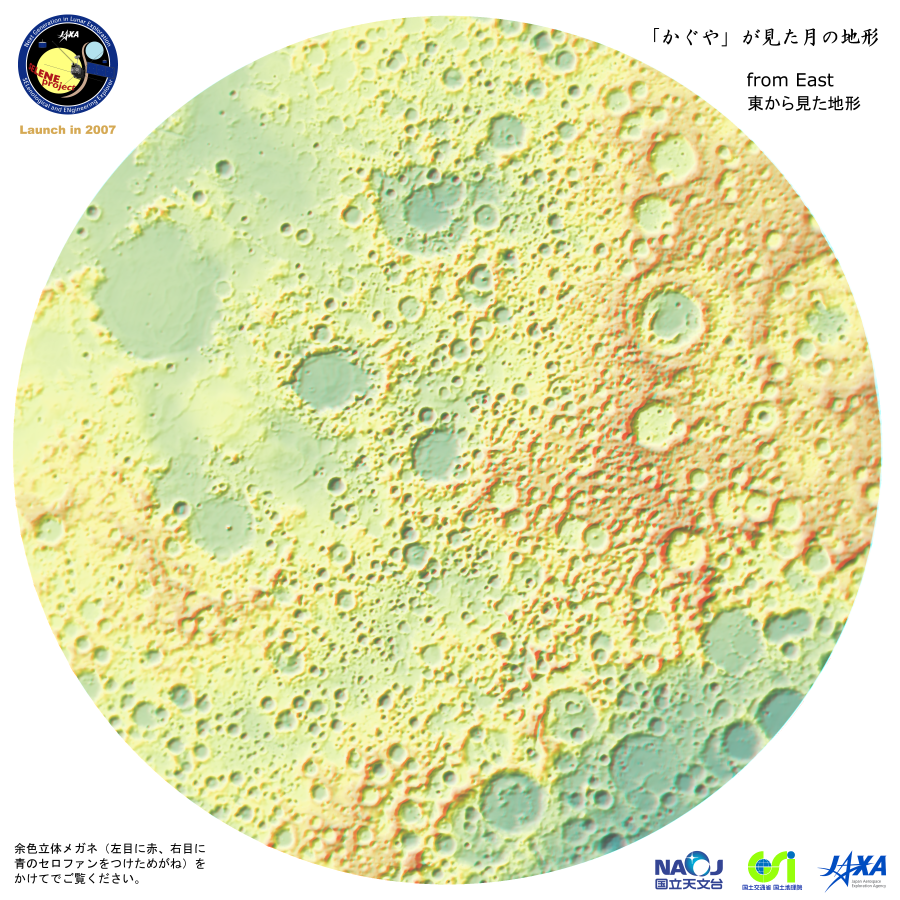
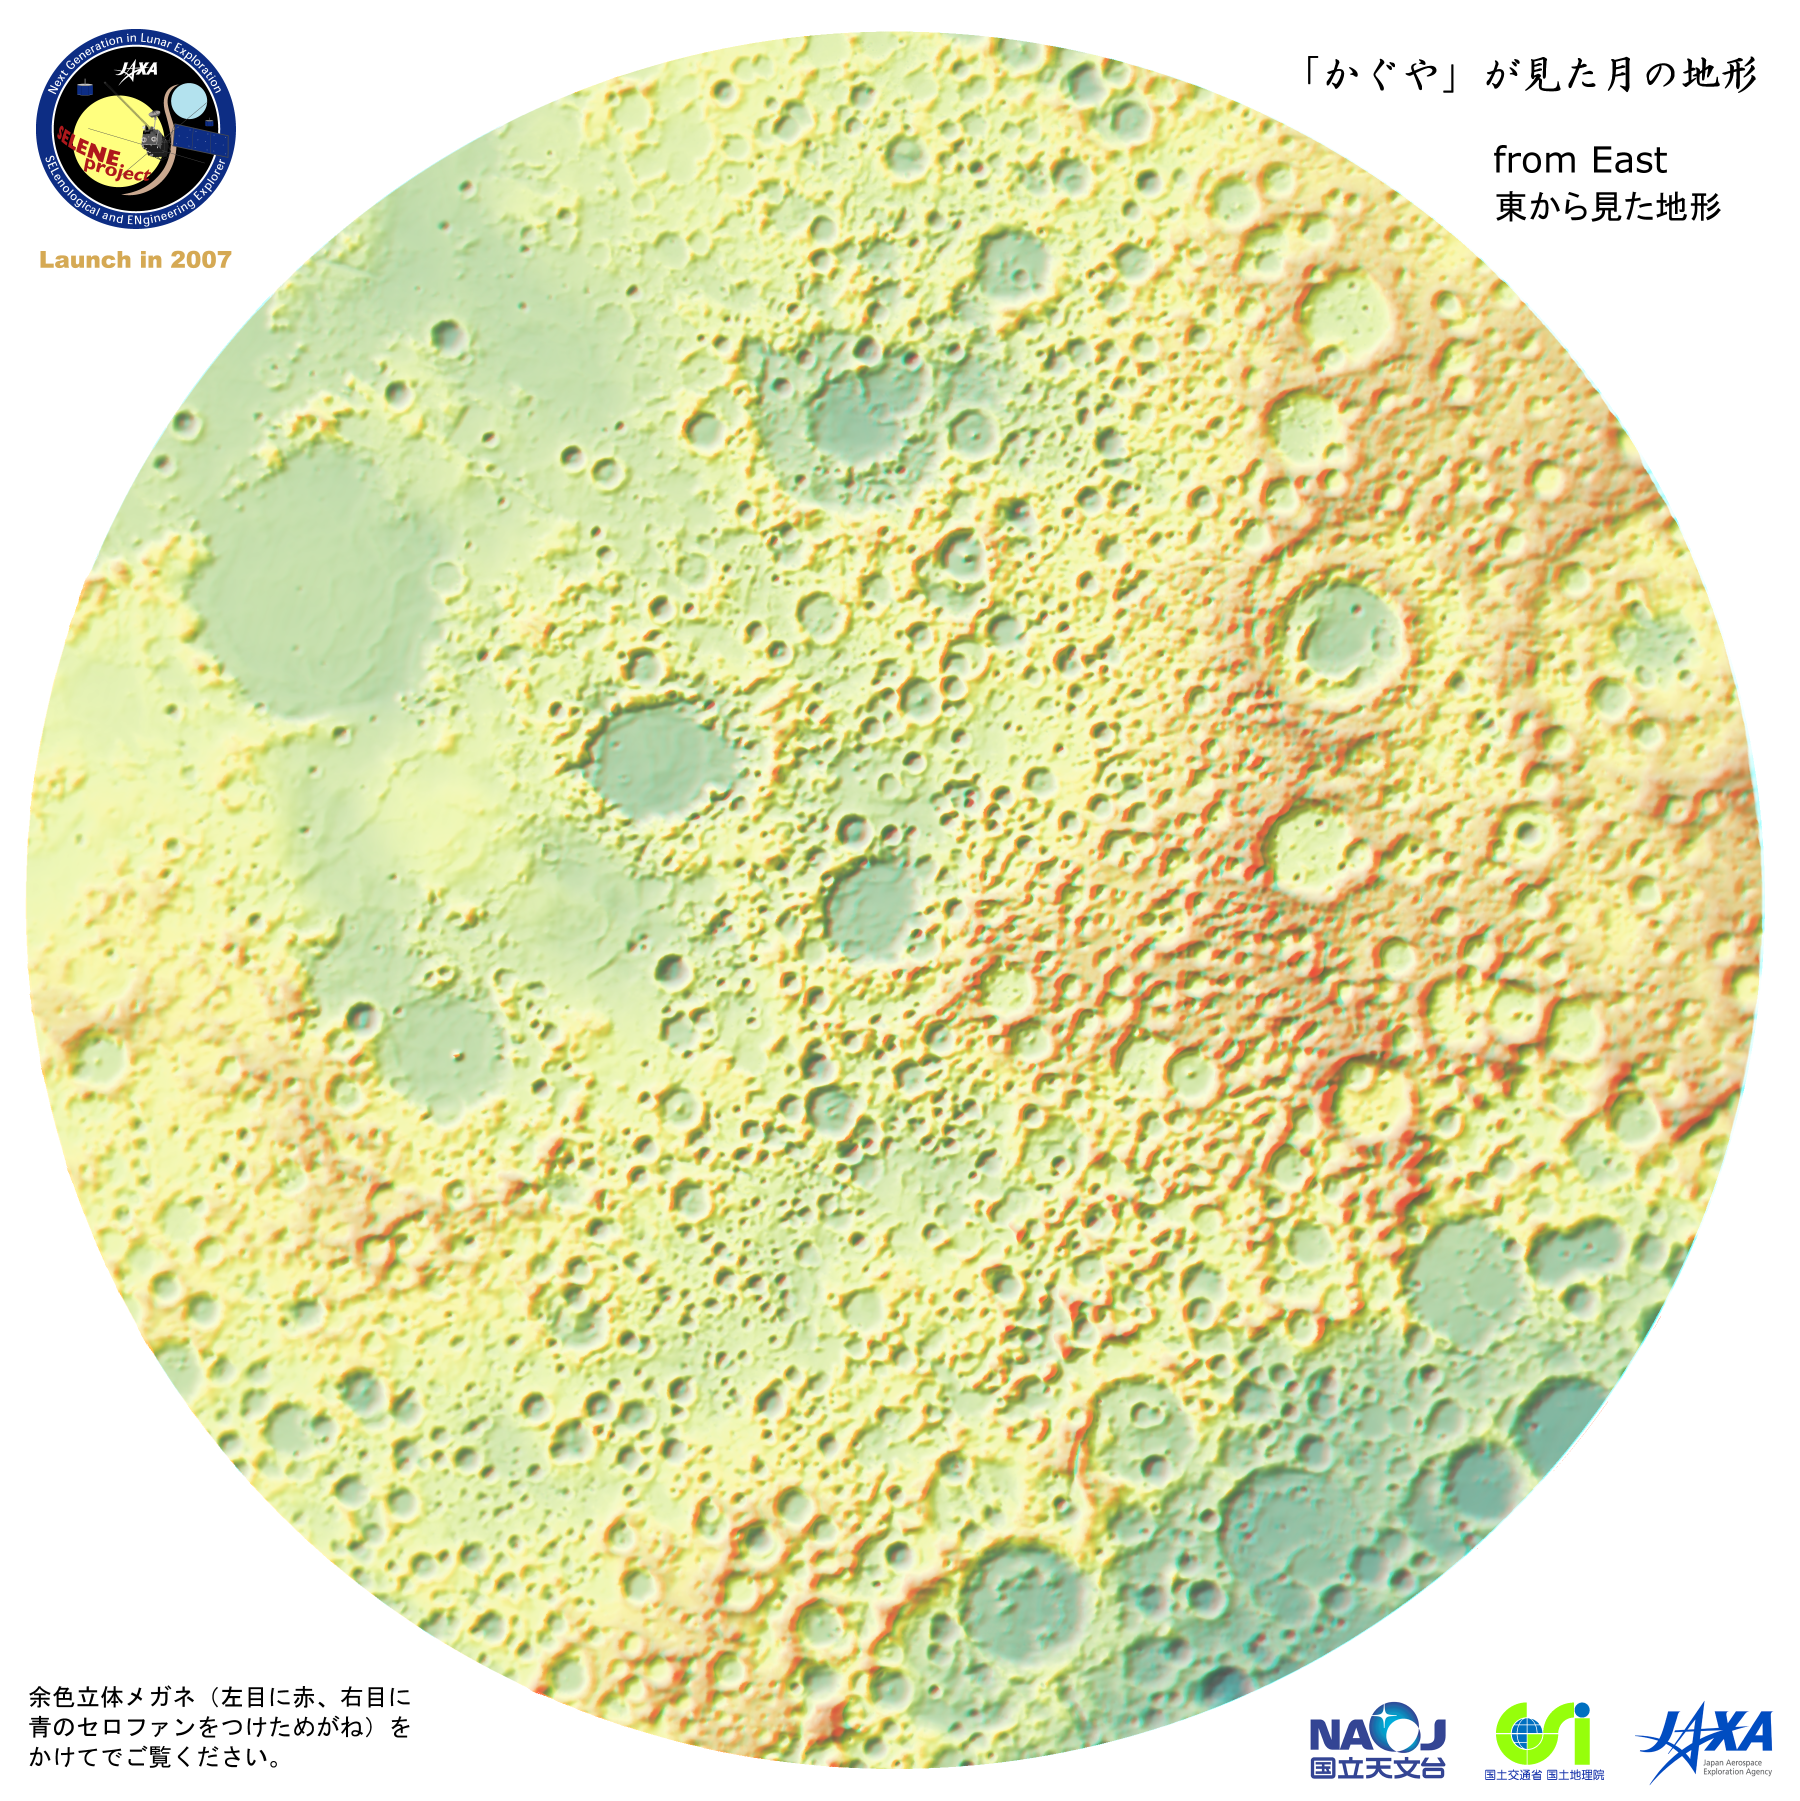
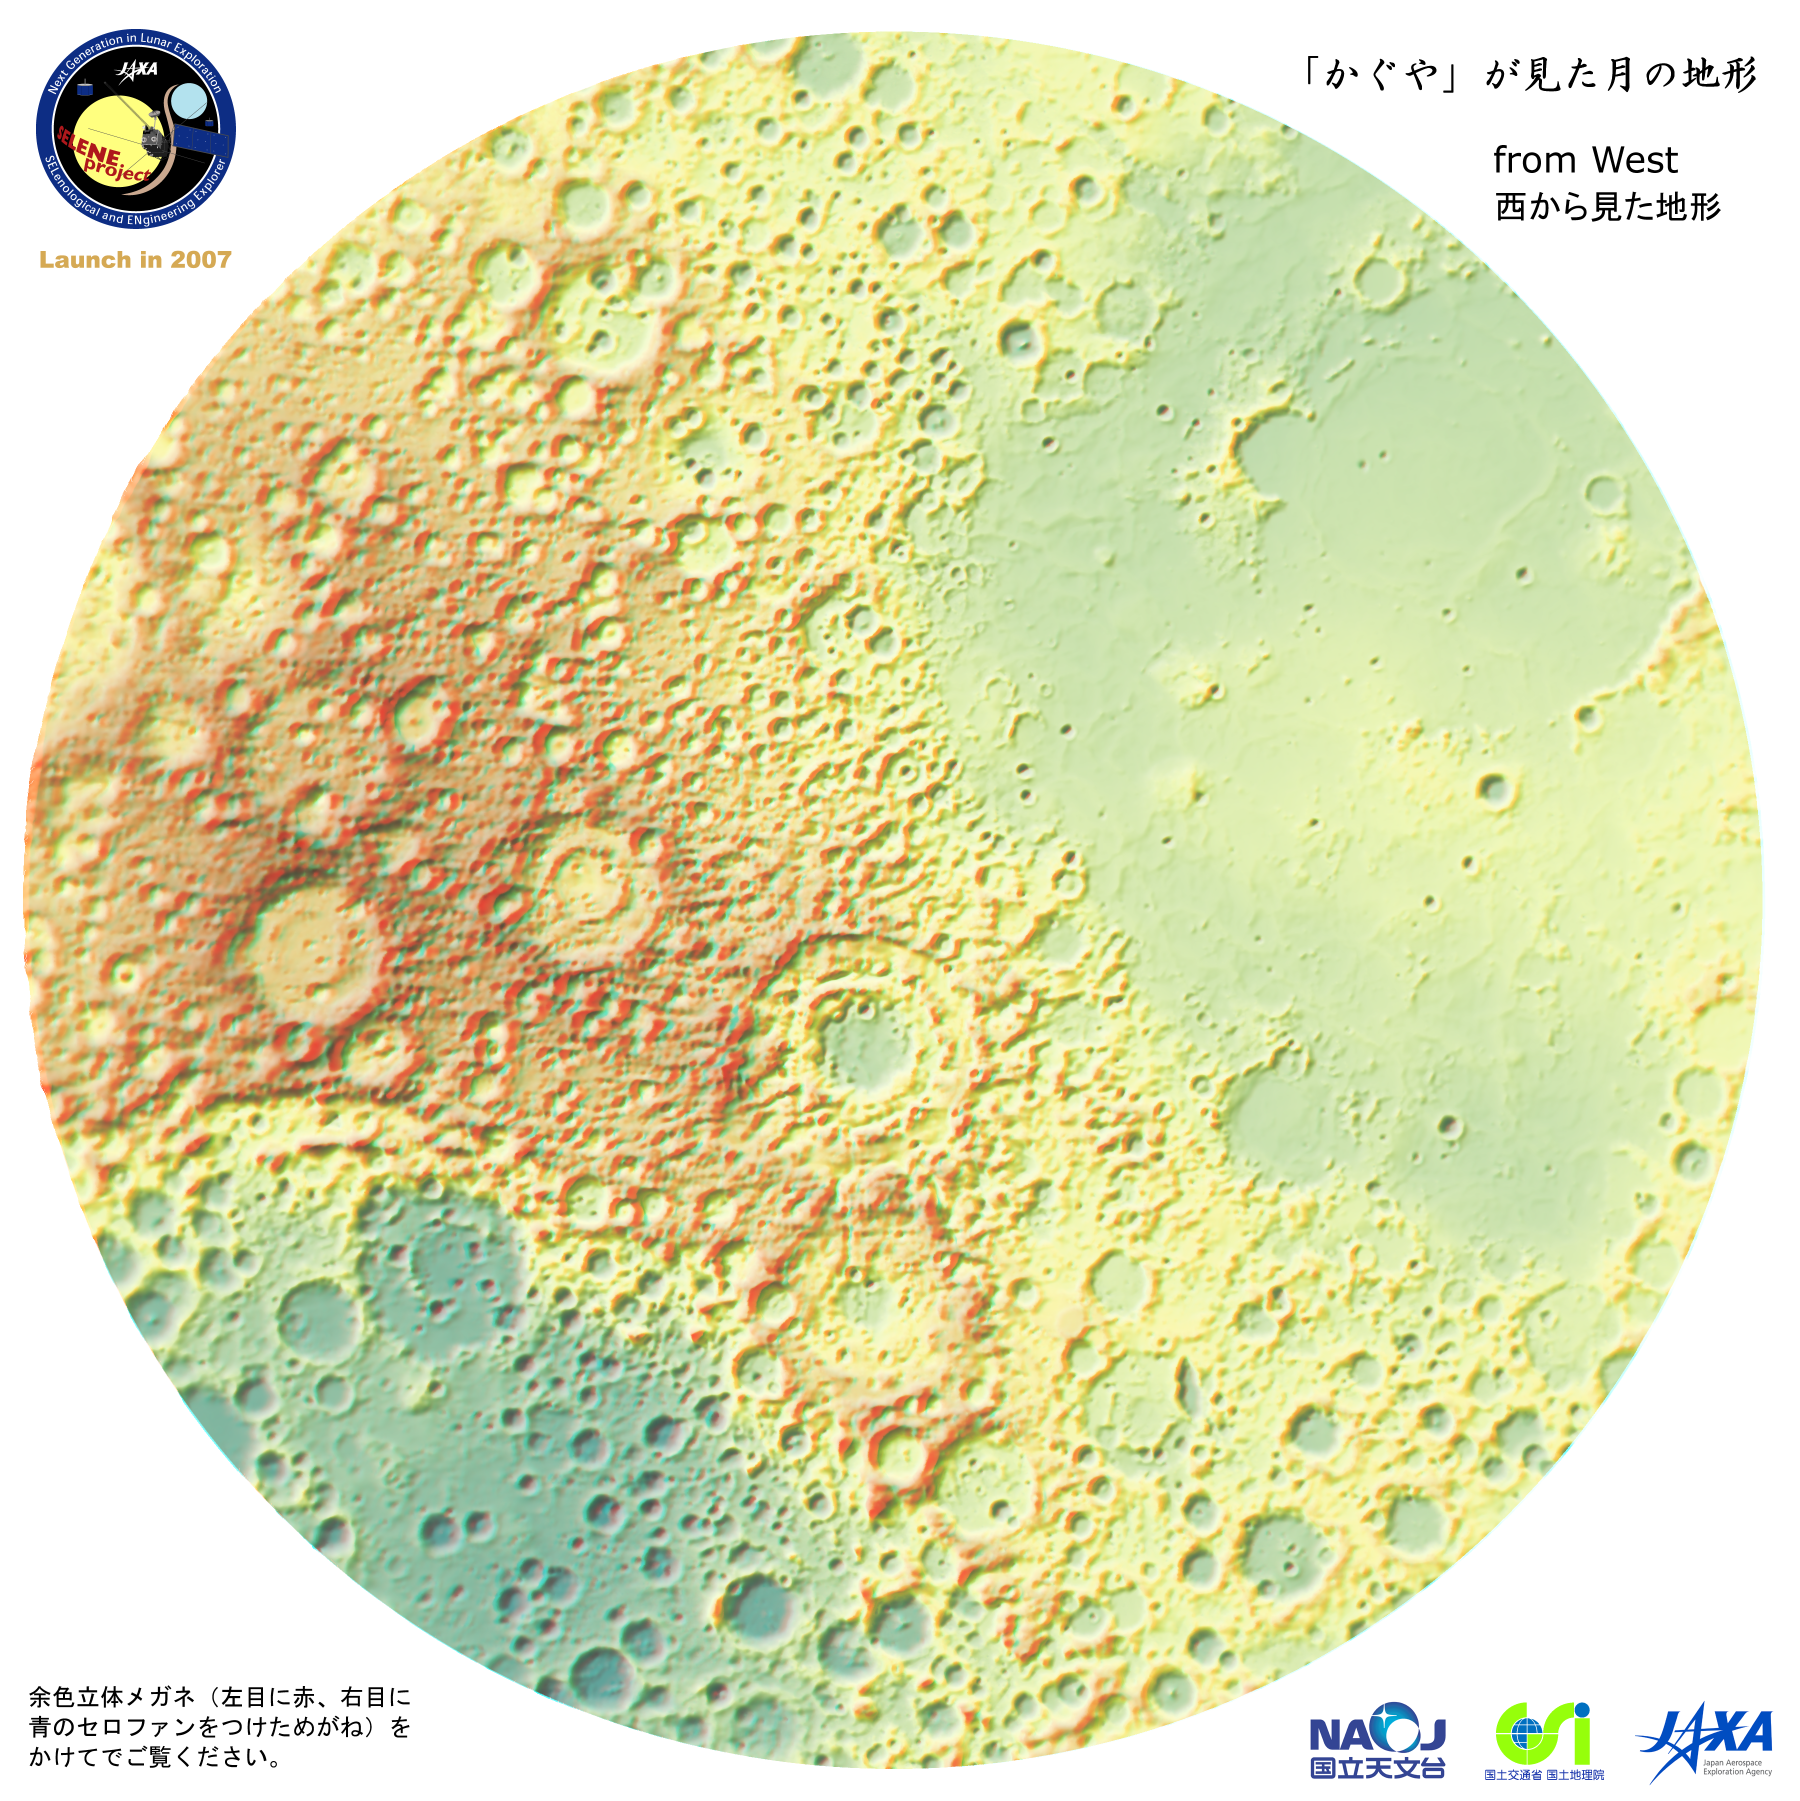
4. Anaglyphs
Anaglyphs are maps that appear to be three-dimensional when viewed through anaglyph glasses. The stereographic projection is used as the map projection for these maps.


5.Topographic maps using data covering period of 8 months (copy for printing)
A0-size manuscript of the topographic map (PDF, 566MB)
A0-size manuscript of the topographic map (zipped EPS, 553MB)
A0-size manuscript of the topographic map (without annotation, PDF, 568MB)
A0-size manuscript of the topographic map (without annotation, zipped EPS, 553MB)
A0-size manuscript of the topographic map (degraded GIF, 4.9MB)
6. Videos of moon in rotation
Around the equator ( S ) (animation GIF, 0.5MB)
Around the equator ( M ) (animation GIF, 2.6MB)
Around the equator ( L ) (animation GIF, 11MB)
Around the equator (XL) (animation GIF, 57MB)
7. Reference pages

PDF形式のファイルをご覧いただく場合には、Adobe Readerが必要です。
Adobe Readerをお持ちでない方は、以下のページからダウンロードしてください。