Summary
M7.7 and M7.6 (AFAD) earthquakes occurred in Turkey on February 6, 2023 (UTC). To measure the crustal deformation caused by this earthquake, we applied interferometric and pixel offset analysis using ALOS-2/PALSAR-2 data. The analysis clearly revealed the spatial distribution of crustal deformation.
- The observed crustal deformation is consistent with that expected for a left-lateral fault.
- Crustal deformation is observed along the East Anatolian Fault and the Çardak Fault.
- In some areas in the proximity of the above fault zone, incoherent phases are observed. The ground surface may have been altered by the earthquake in these areas.
- Over 5m displacement was observed across the East Anatolian fault. And, over 4m displacement was observed across the Çaldak fault.
InSAR pair
Fig.
# |
Date |
Time
(UTC) |
Flight
Dir. |
Beam
Dir. |
Obs.
Mode *1 |
Incidence Angle
(around epicenter) |
Bperp |
| 1,2,3 |
2022-09-16
2023-02-17 |
9:33 |
Des. |
Right |
W-W
(350km) |
41.5° |
-49m |
| 4,5,6 |
2022-09-05
2023-02-20 |
21:28 |
Asc. |
Right |
W-W
(350km) |
40.5° |
15m |
| 7,8,9,11 |
2022-09-10
2023-02-11 |
21:35 |
Asc. |
Right |
W-W
(350km) |
47.4° |
-233m |
| 7,8,10,12 |
2022-09-11
2023-02-12 |
9:25 |
Des. |
Right |
W-W
(350km) |
47.4° |
464m |
| 13,14,15 |
2022-04-06
2023-02-08 |
9:40 |
Des. |
Right |
F-F
(10m) |
31.7° |
-435m |
| 16,17,18 |
2019-09-18
2023-02-15 |
21:21 |
Asc. |
Right |
W-W
(350km) |
44.9° |
-16m |
*1 F: Stripmap (Fine), W:ScanSAR(Wide)
(cf. ALOS-2 Project / PALSAR-2 (JAXA))
SAR Interferograms
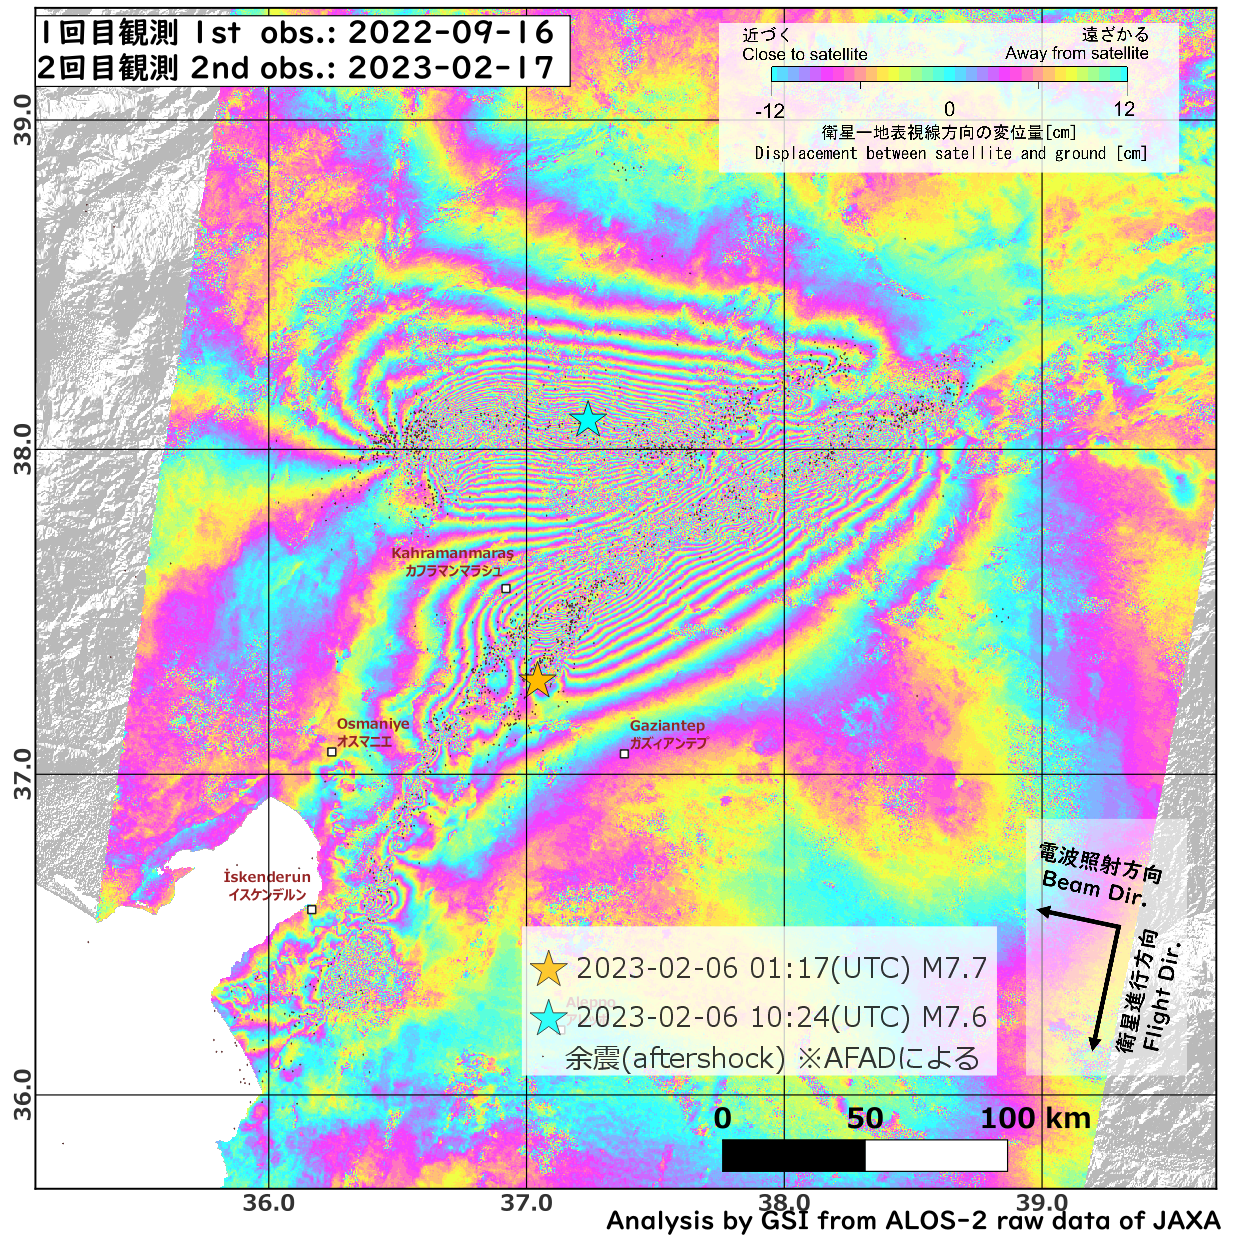
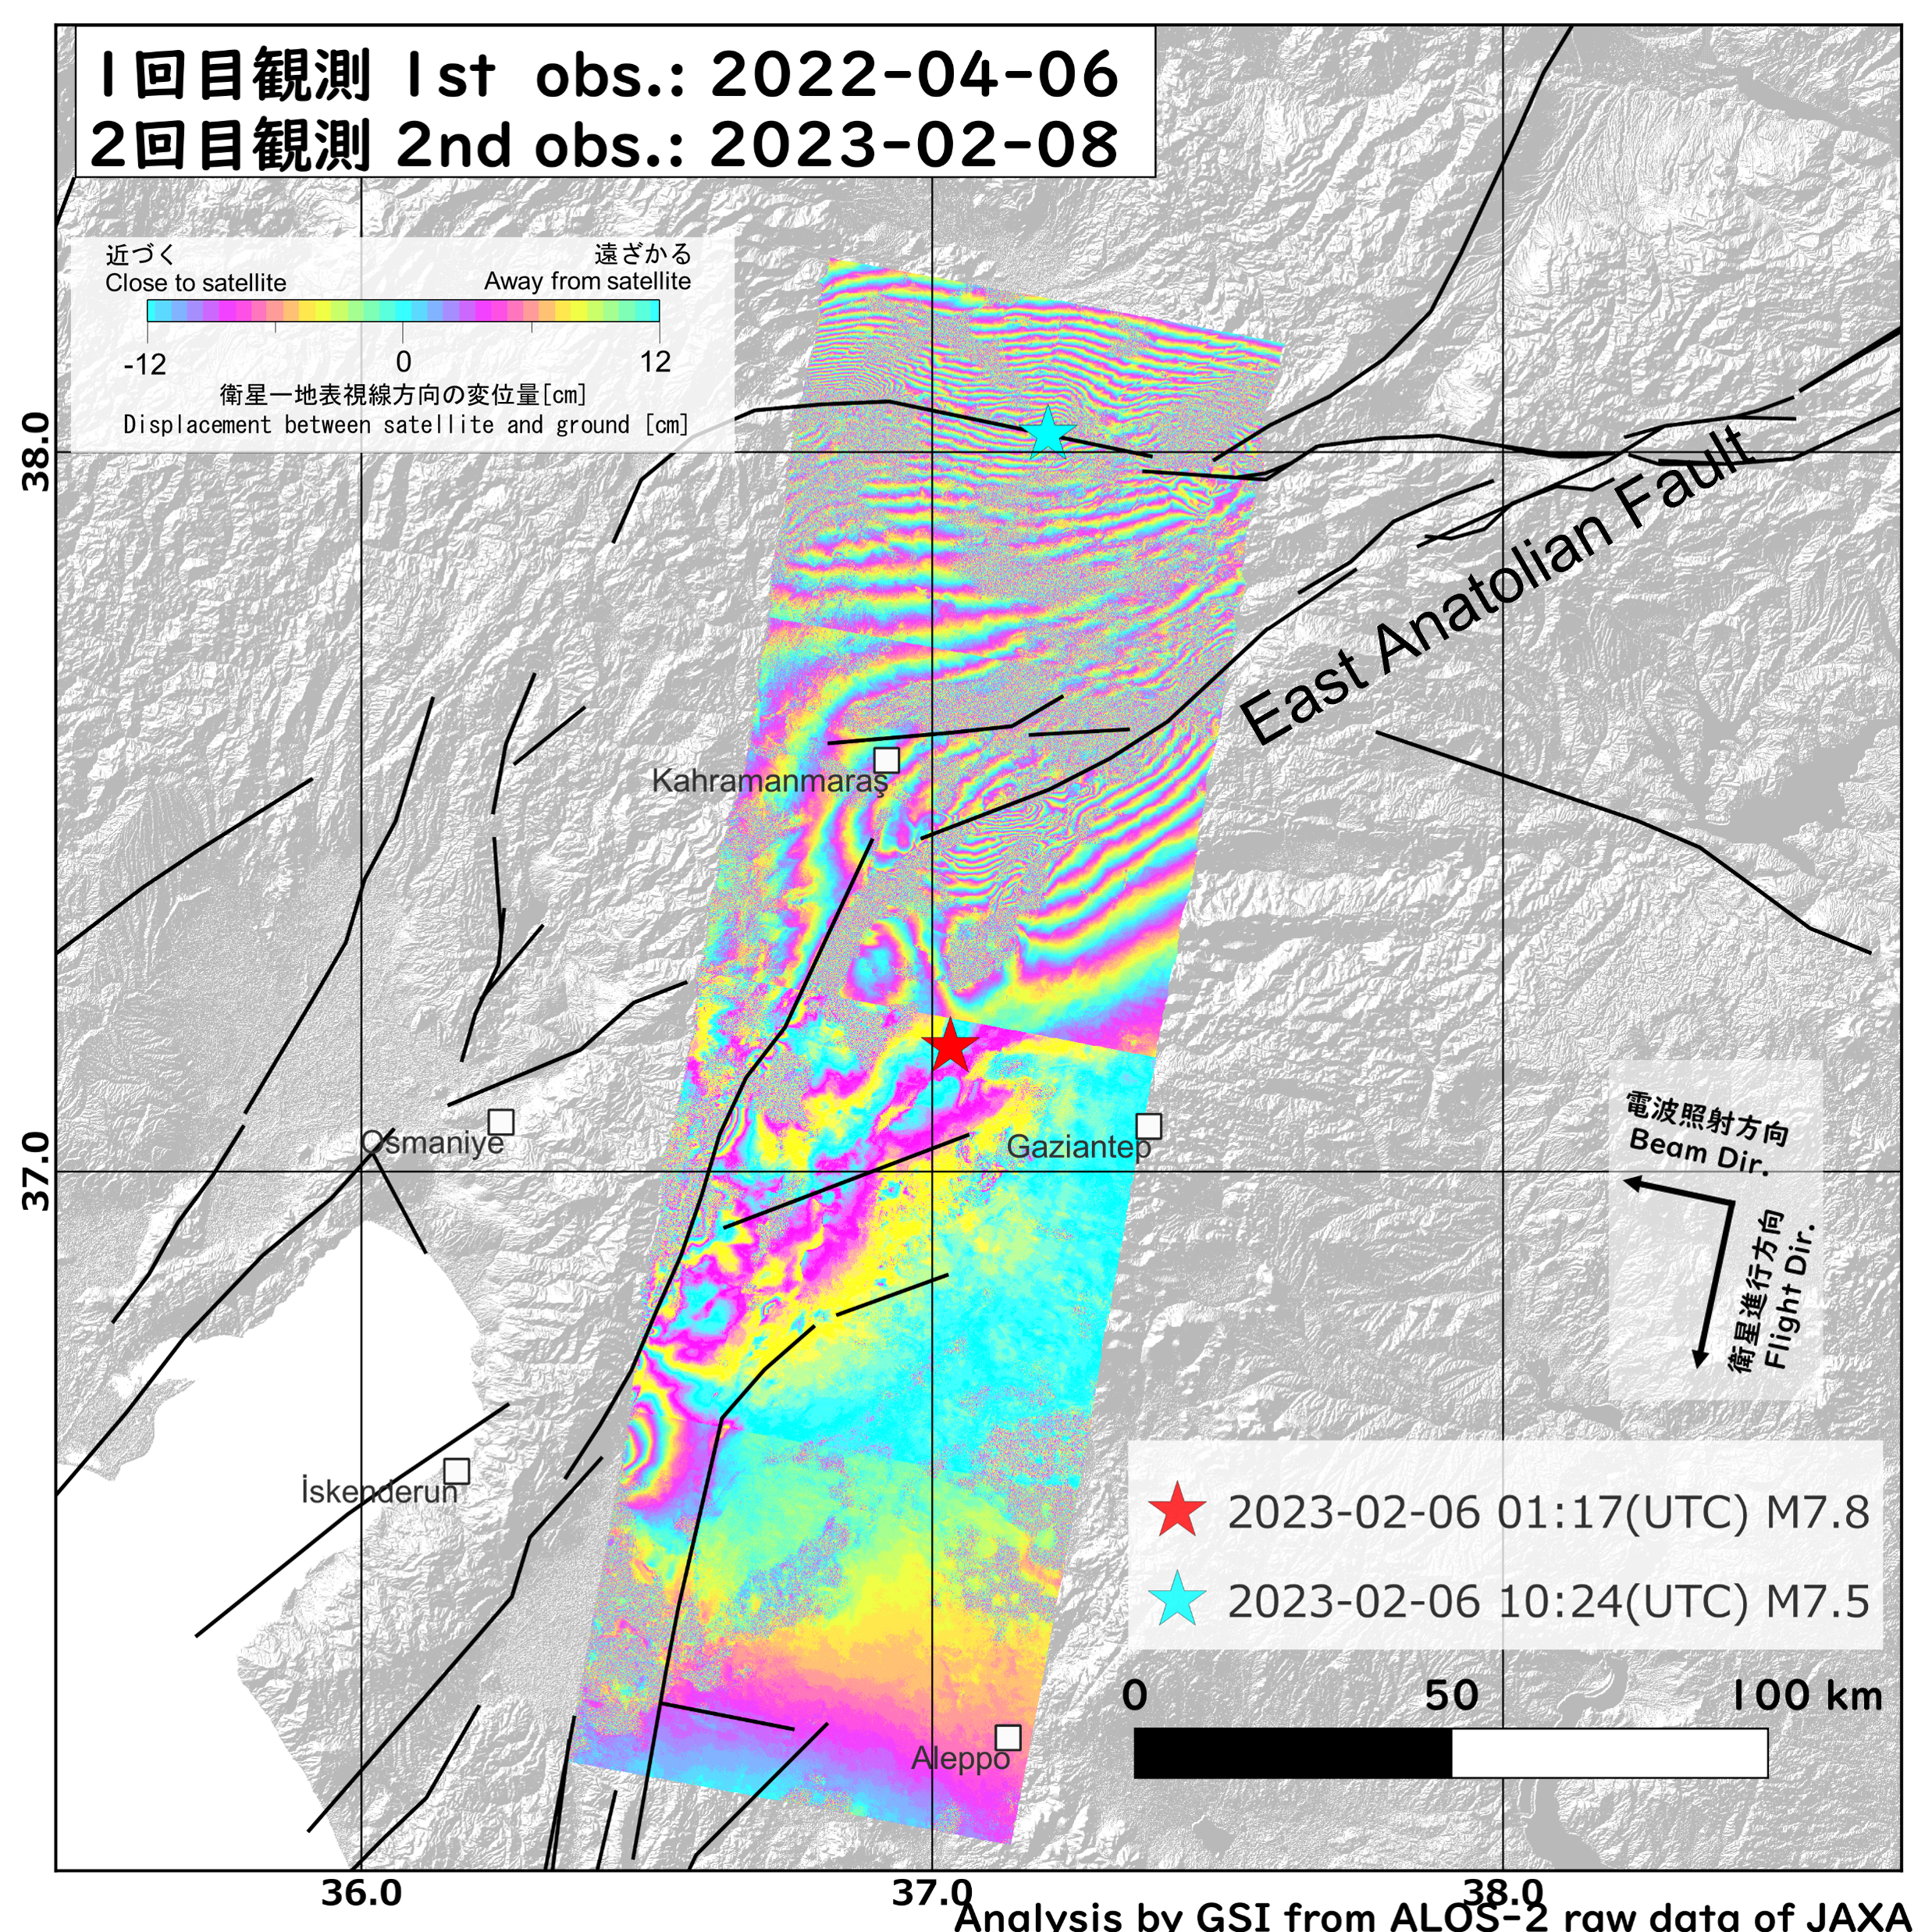
Fig. 1 SAR interferogram [PNG: 1MB]
Epicenter and aftershock distribution are from AFAD catalog.
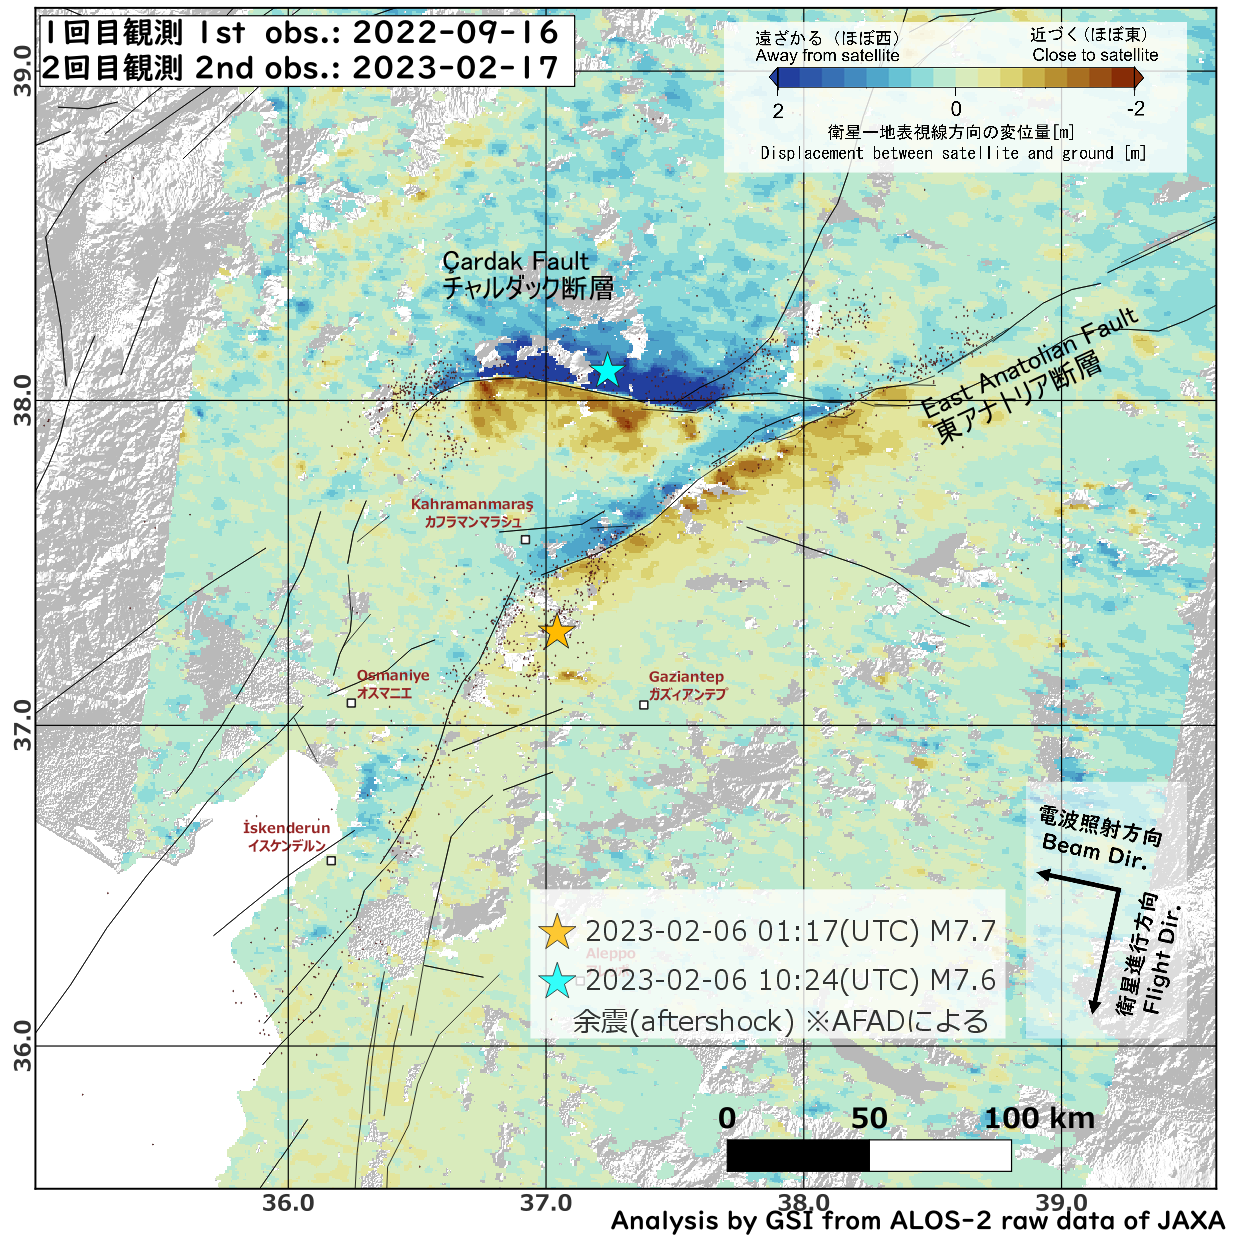
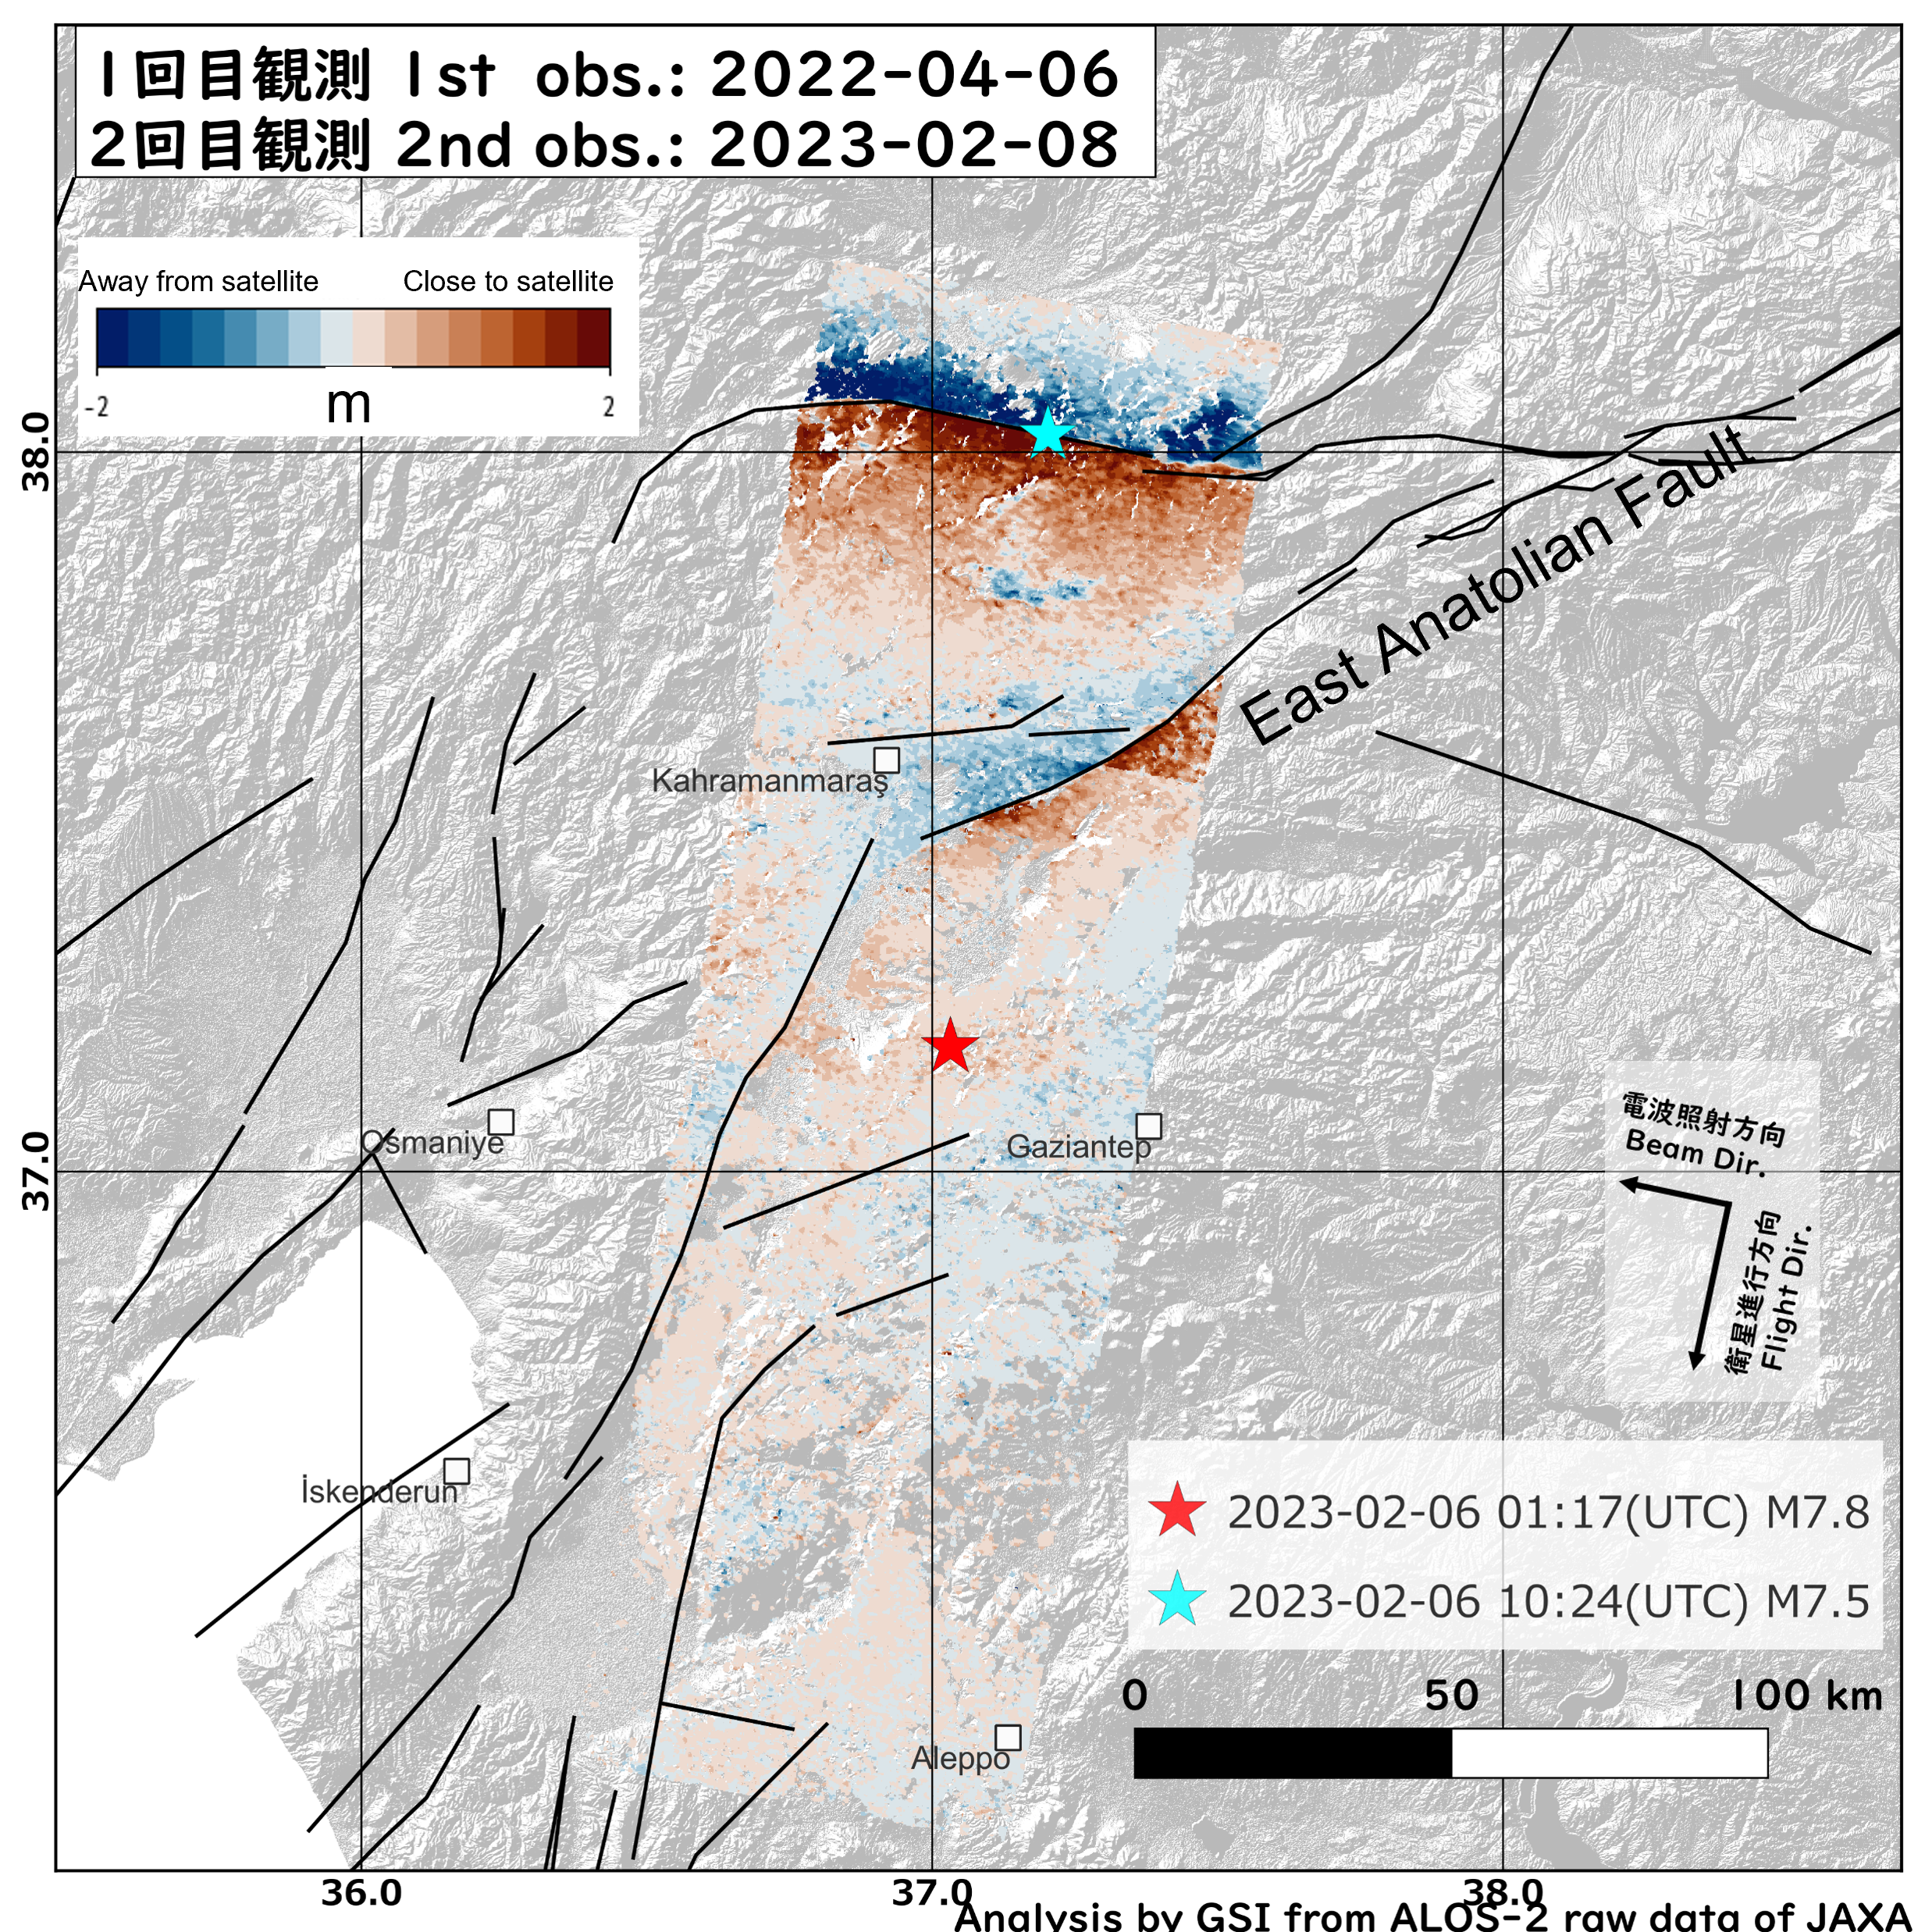
Fig. 2 Pixel offset method image(Beam Direction). [PNG: 1MB]
Epicenter and aftershock distribution are from AFAD catalog.
Fault lines are based on Styron et al. (2020)
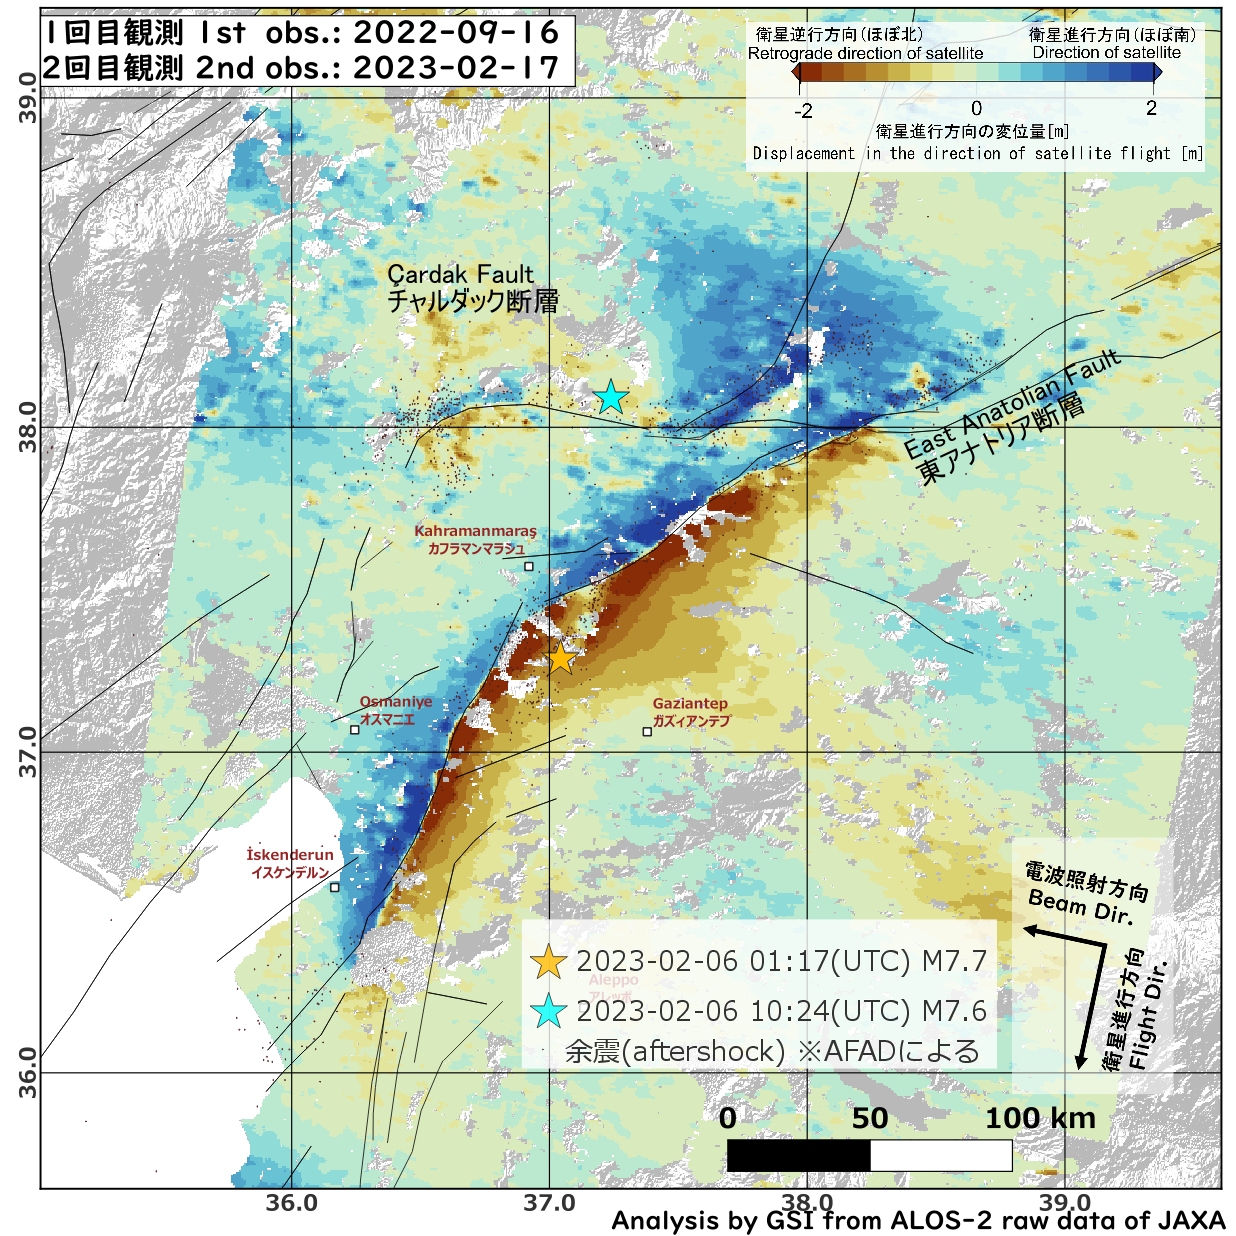
Fig. 3 Pixel offset method image(Flight Direction). [PNG: 1MB]
Epicenter and aftershock distribution are from AFAD catalog.
Fault lines are based on Styron et al. (2020)
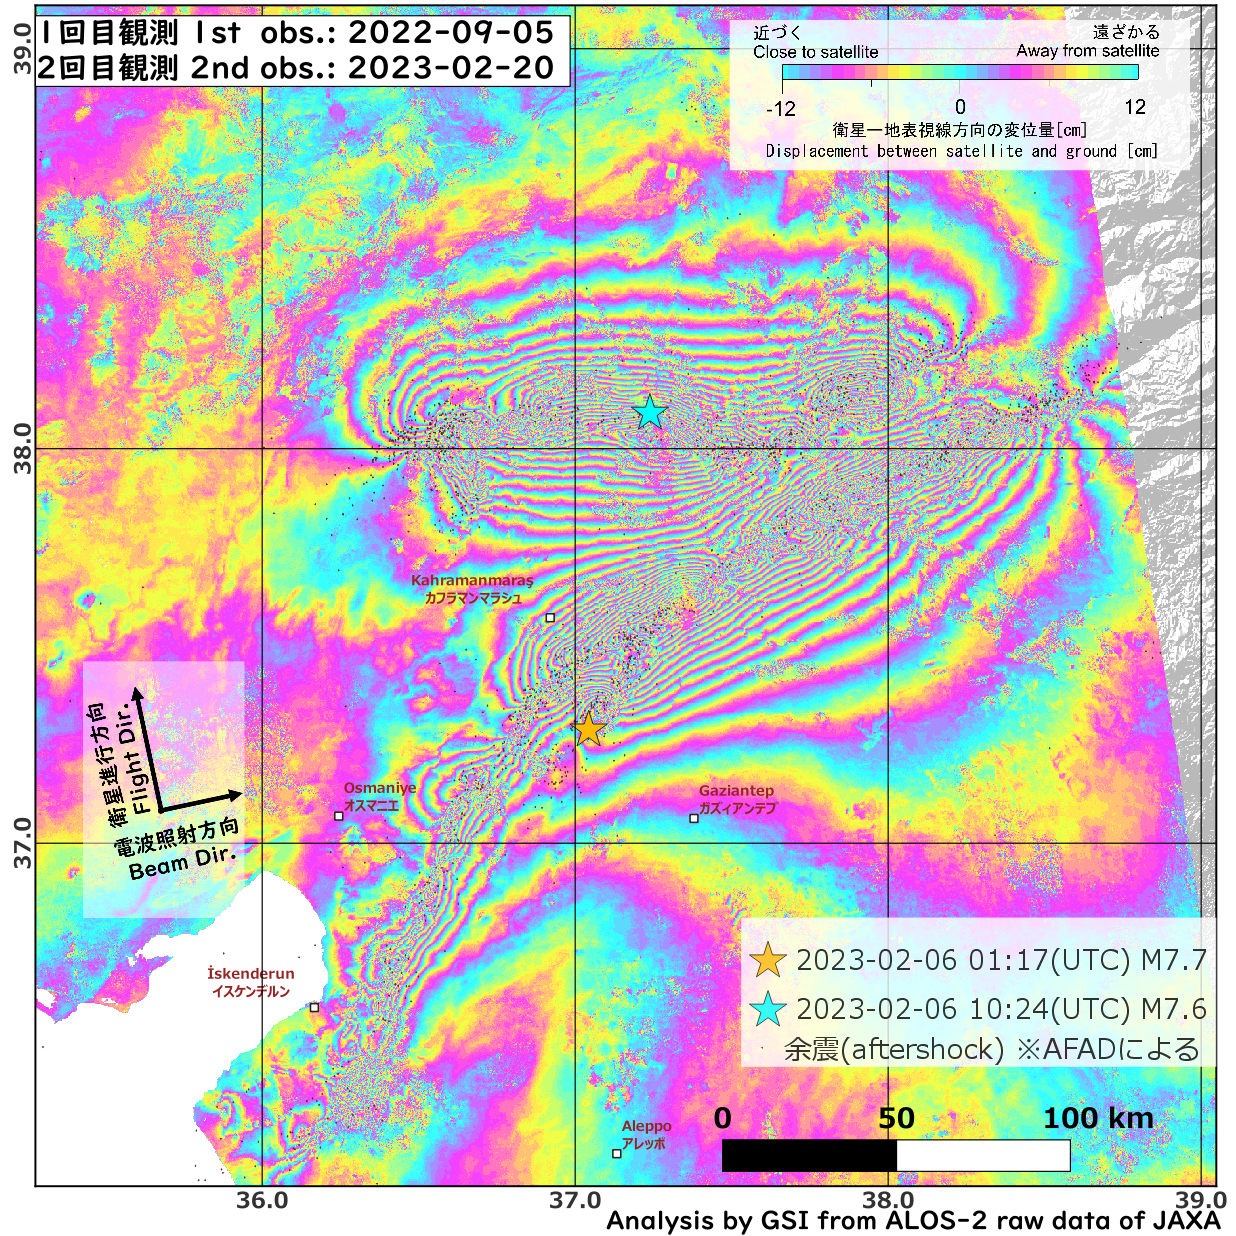
Fig. 4 SAR interferogram [PNG: 1MB]
Epicenter and aftershock distribution are from AFAD catalog.
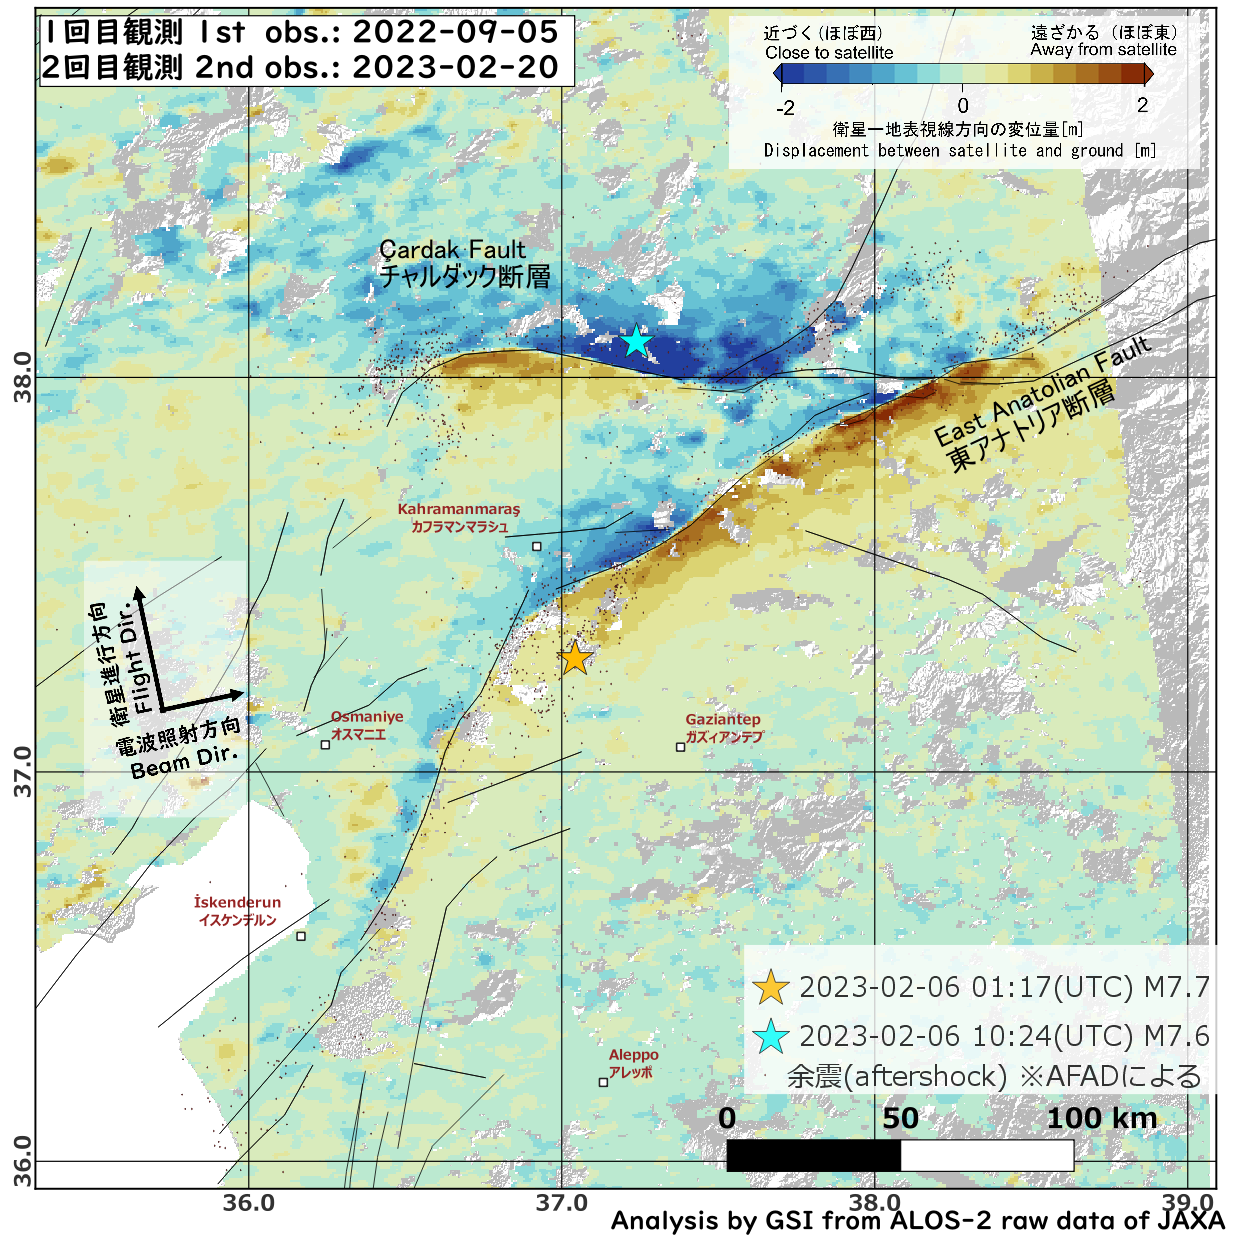
Fig. 5 Pixel offset method image(Beam Direction). [PNG: 1MB]
Epicenter and aftershock distribution are from AFAD catalog.
Fault lines are based on Styron et al. (2020)
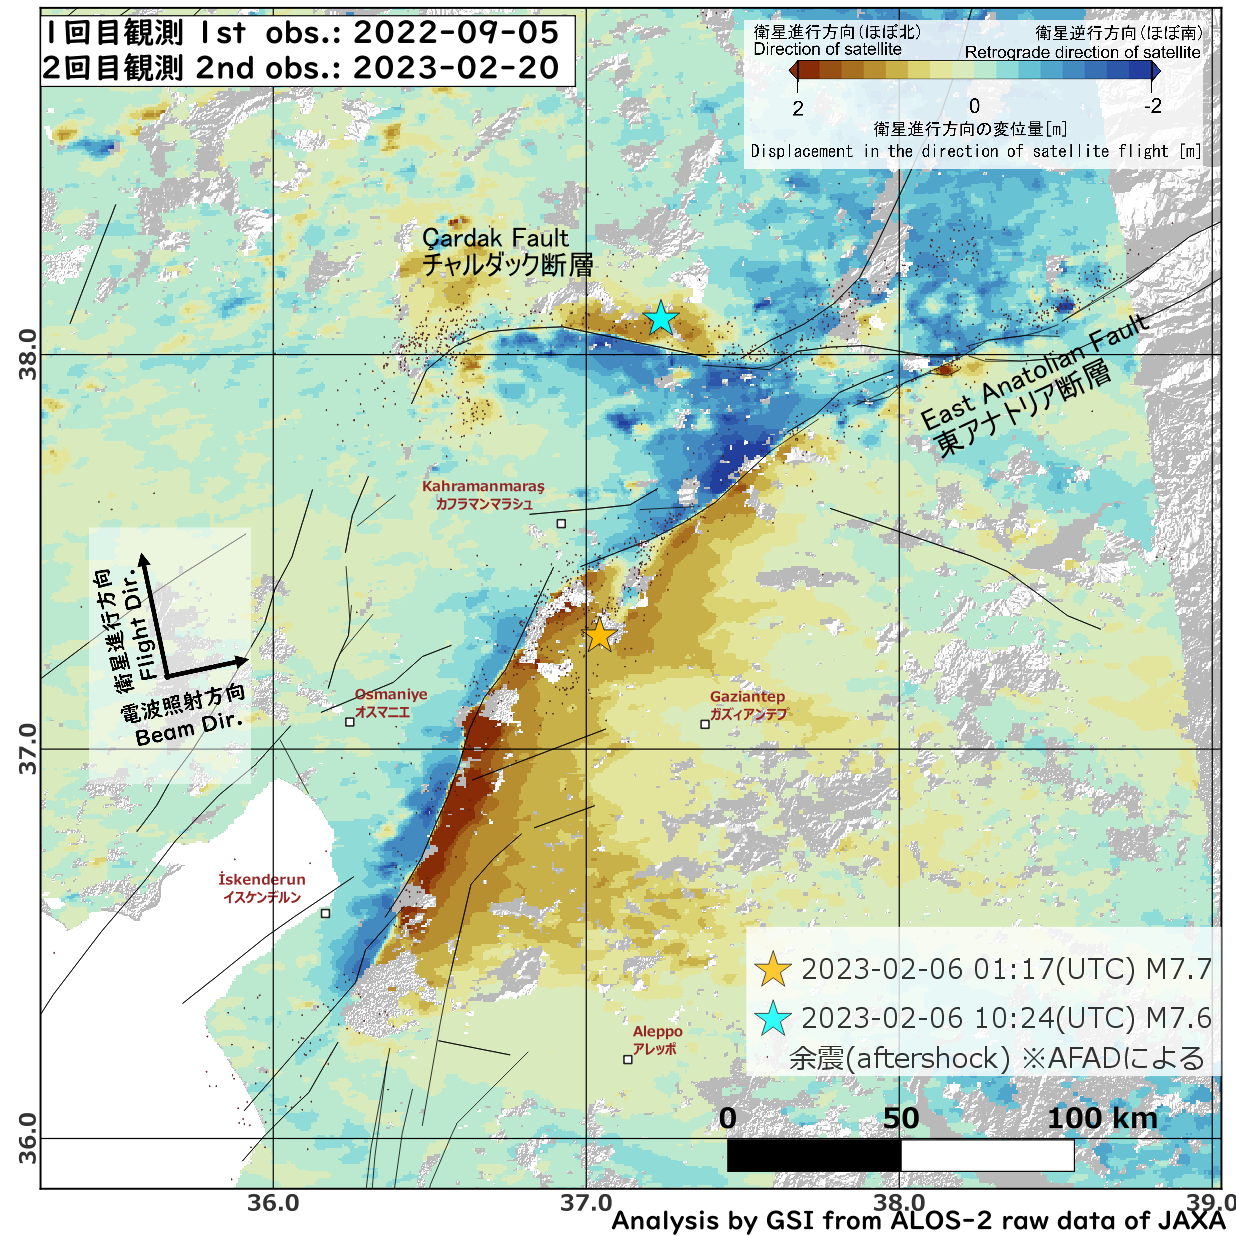
Fig. 6 Pixel offset method image(Flight Direction). [PNG: 1MB]
Epicenter and aftershock distribution are from AFAD catalog.
Fault lines are based on Styron et al. (2020)
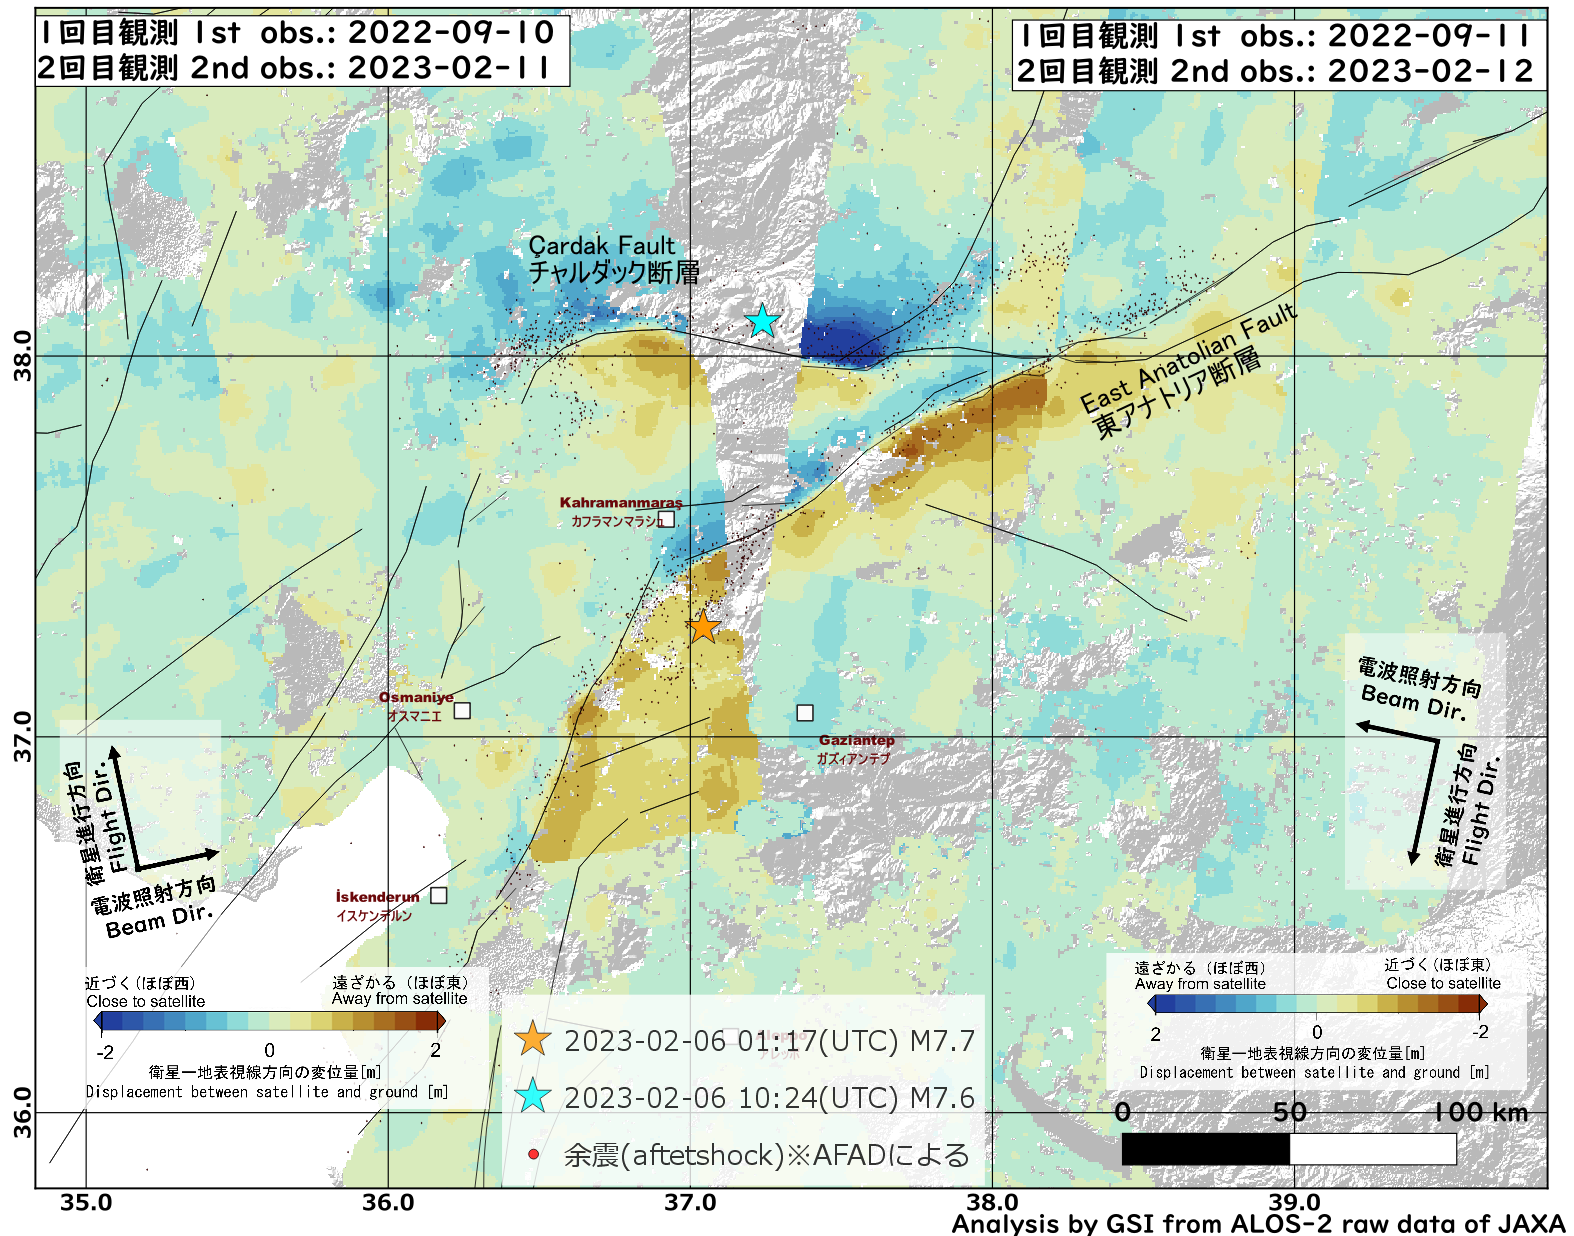
Fig. 7 Pixel offset method image(Beam Direction). [PNG: 1MB]
Epicenter and aftershock distribution are from AFAD catalog.
Fault lines are based on Styron et al. (2020)
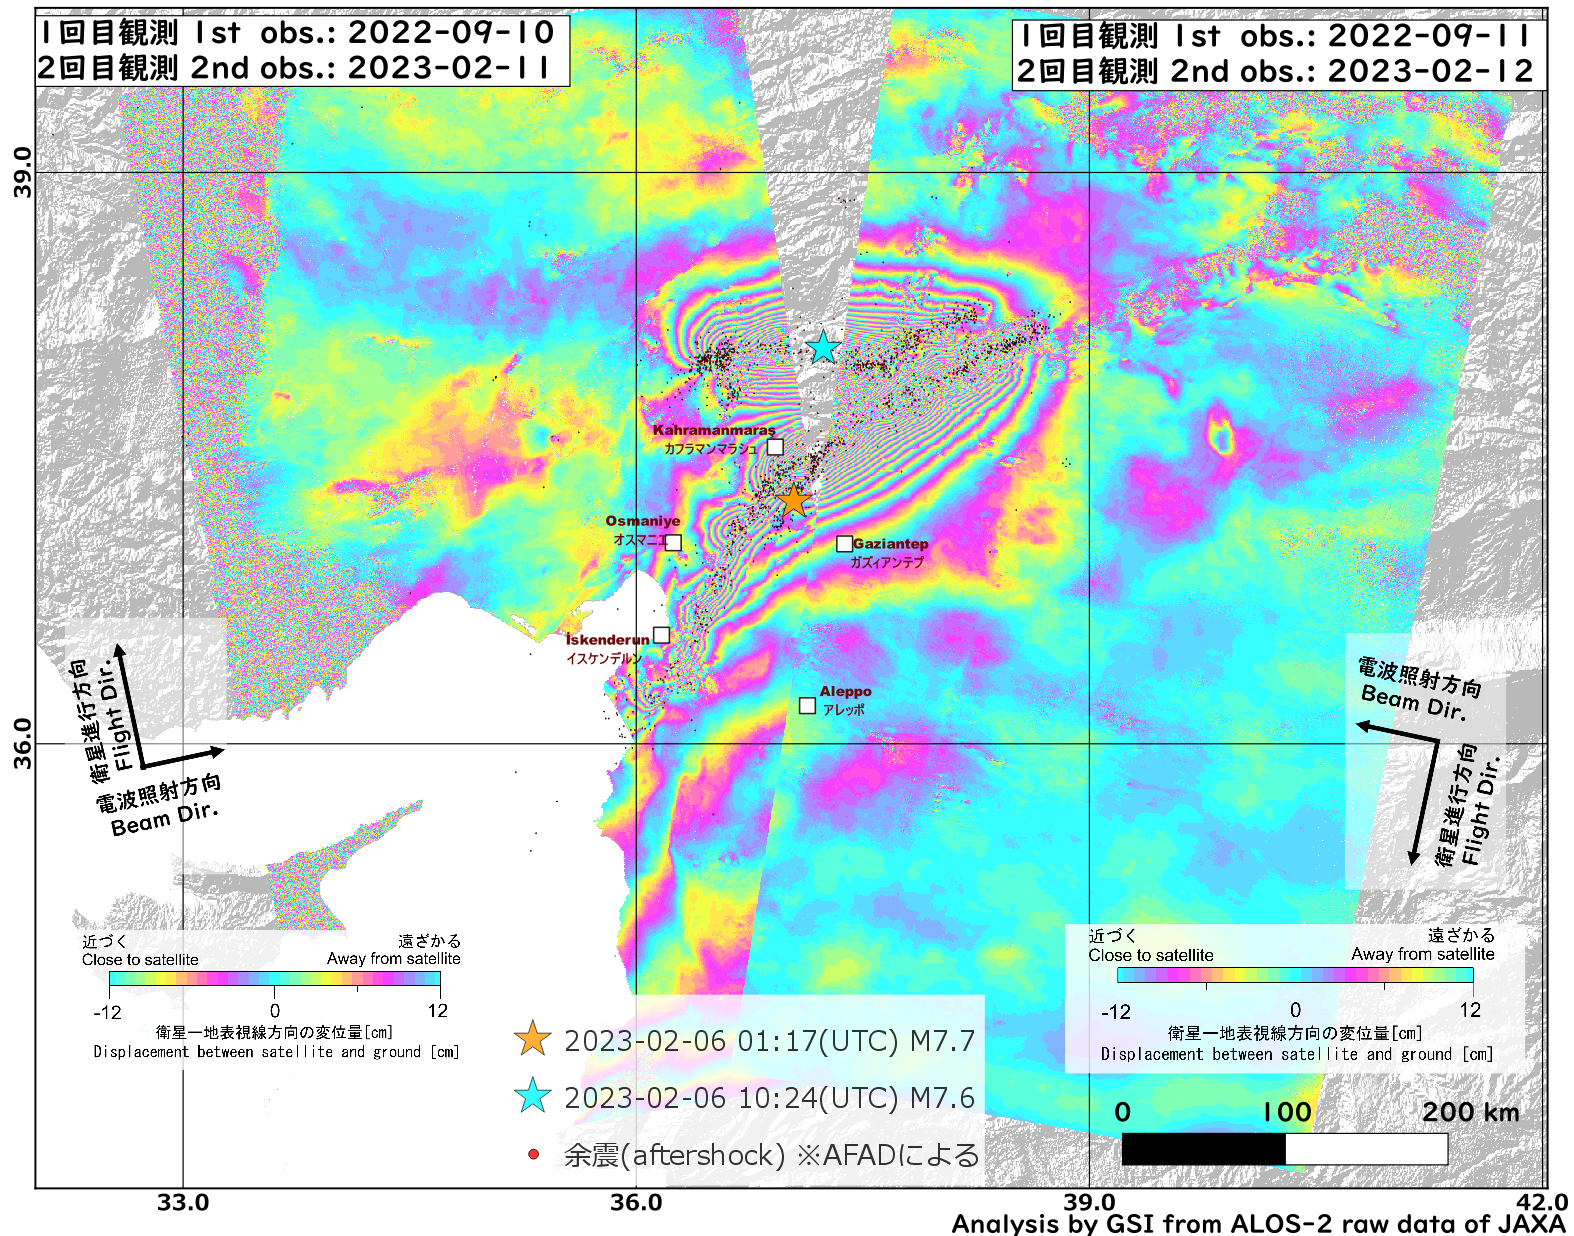
Fig. 8 SAR interferogram. [PNG: 1MB]
Epicenter and aftershock distribution are from AFAD catalog.
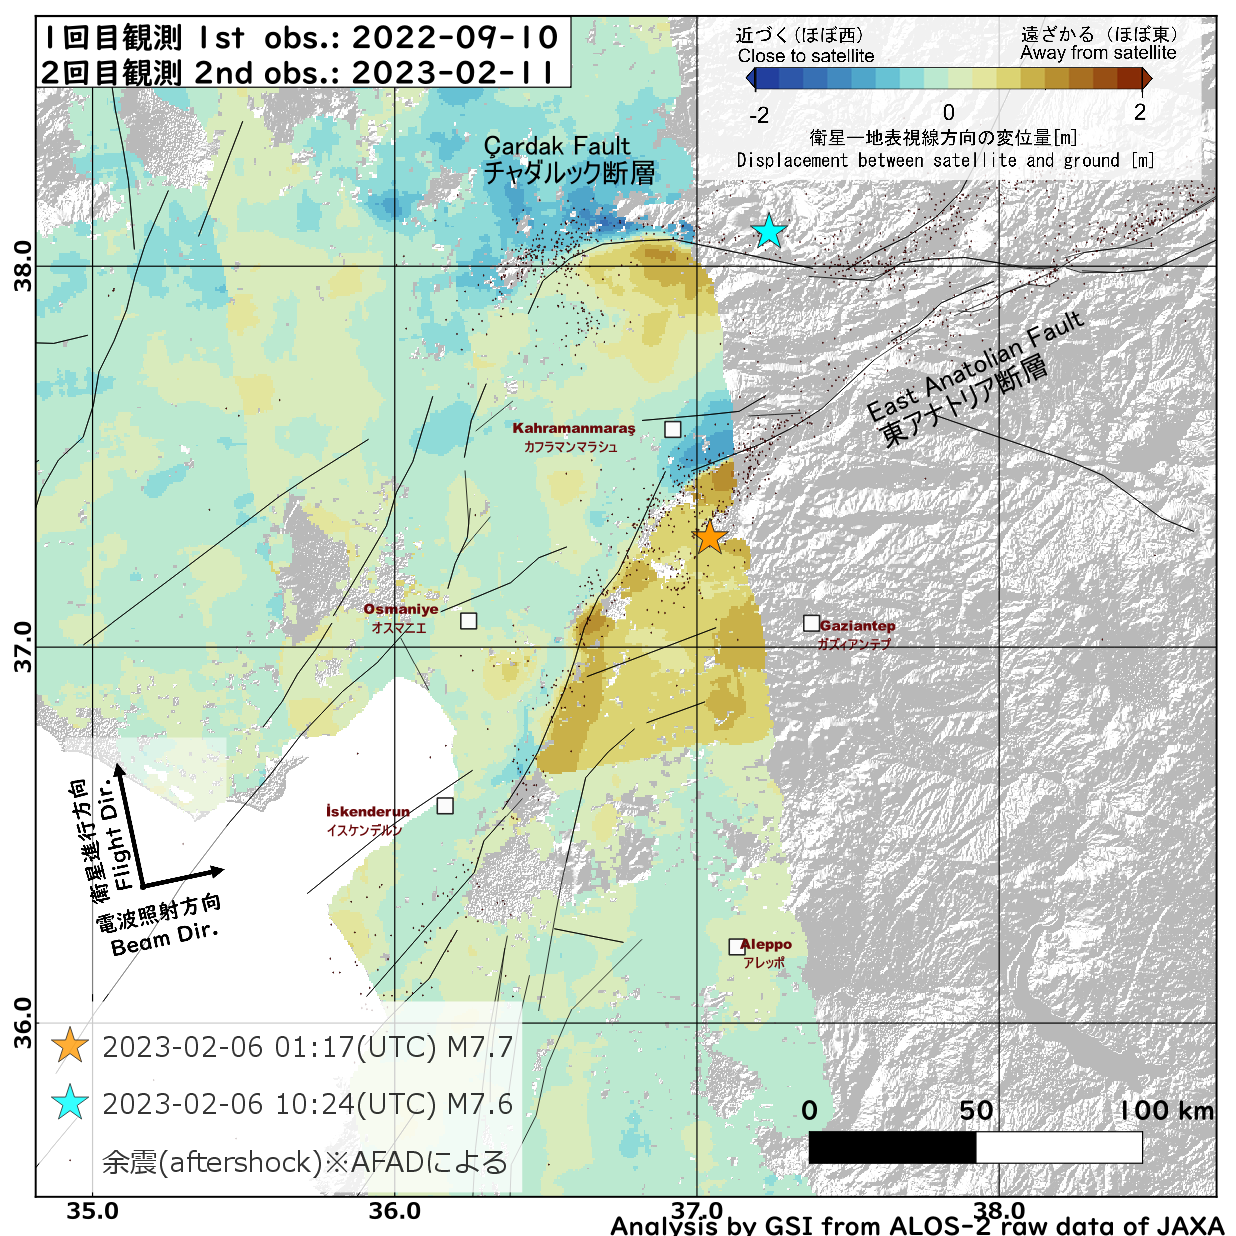
Fig. 9 Pixel offset method image(Beam Direction). [PNG: 1MB]
Epicenter and aftershock distribution are from AFAD catalog.
Fault lines are based on Styron et al. (2020)
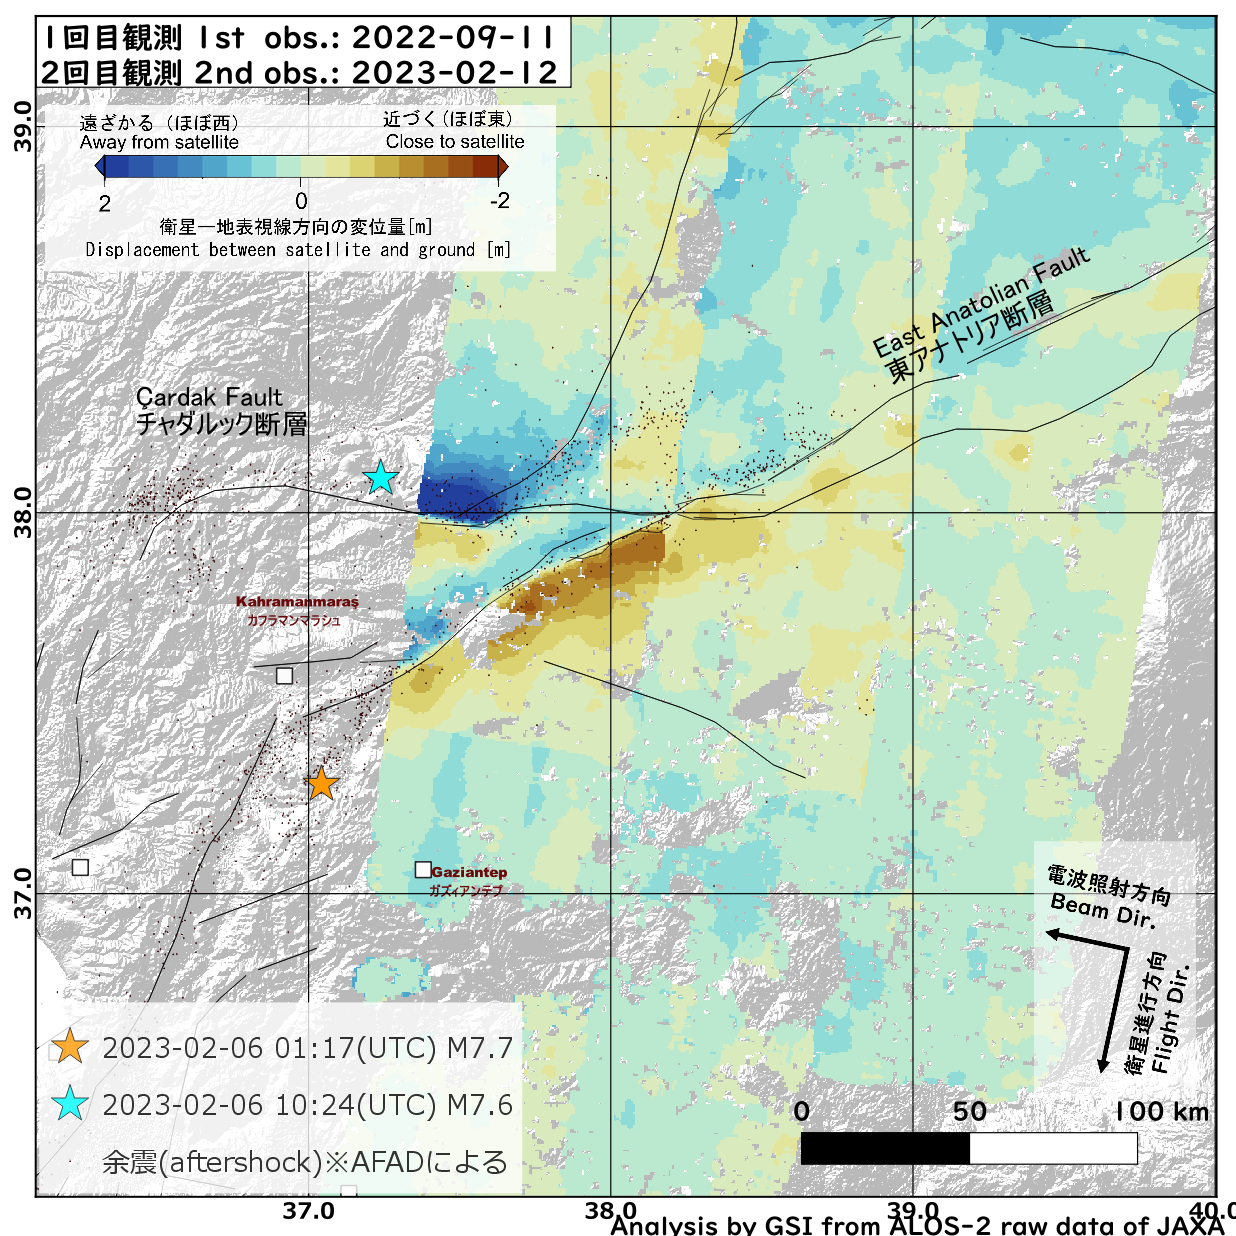
Fig. 10 Pixel offset method image(Beam Direction). [PNG: 1MB]
Epicenter and aftershock distribution are from AFAD catalog.
Fault lines are based on Styron et al. (2020)
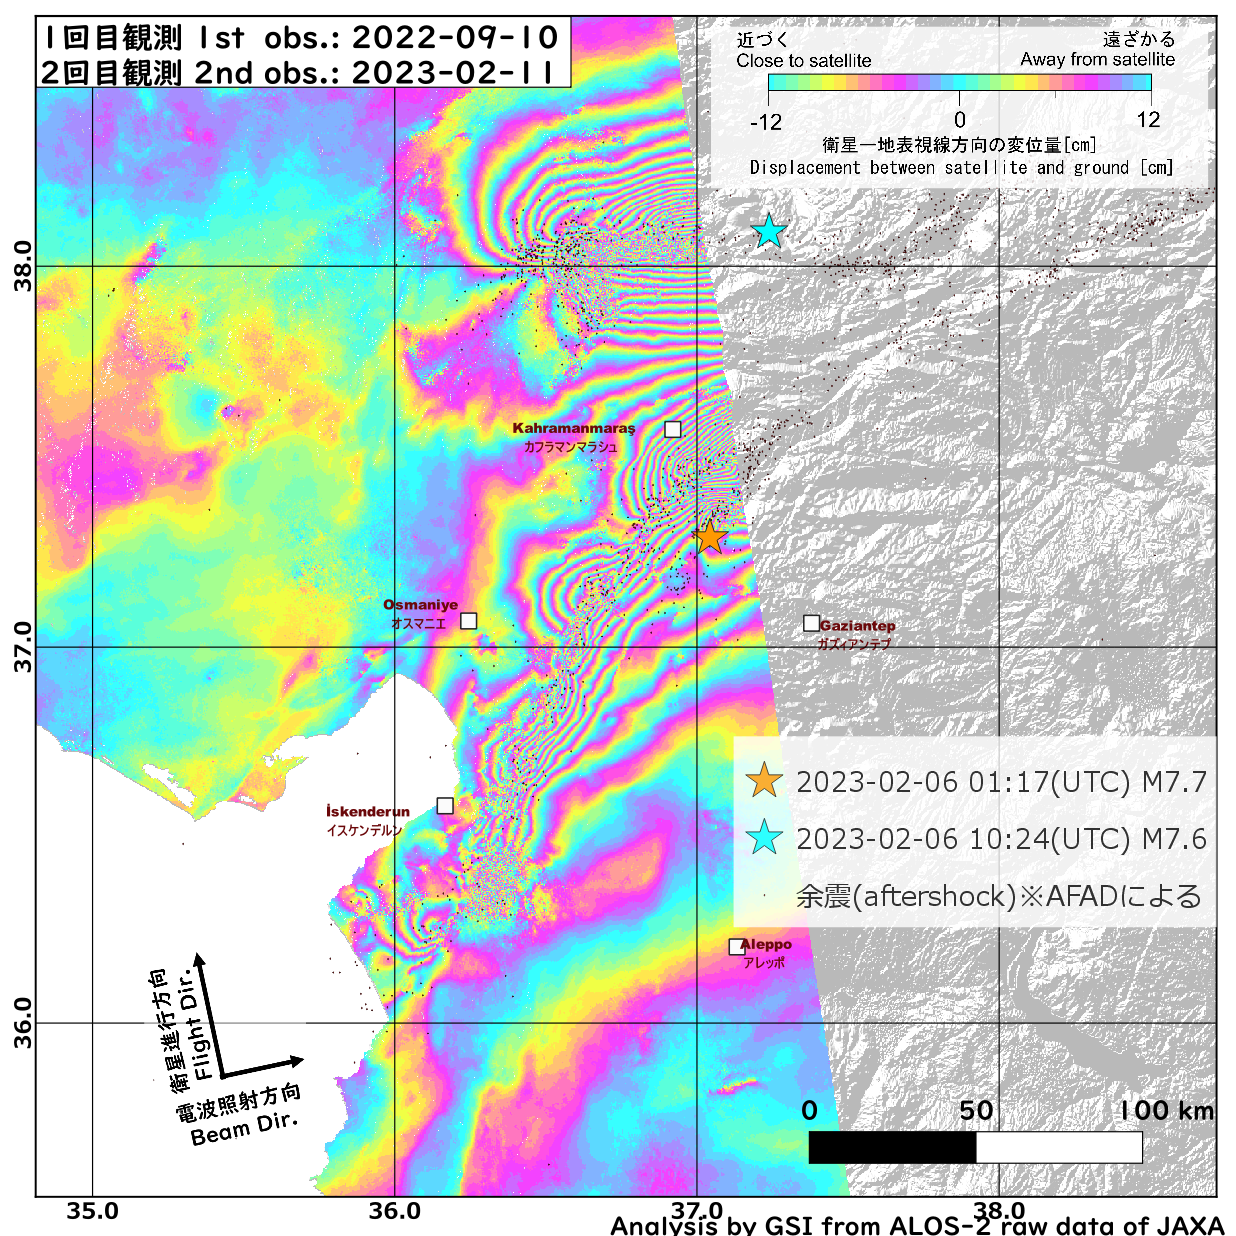
Fig. 11 SAR interferogram [PNG: 1MB]
Epicenter and aftershock distribution are from AFAD catalog.
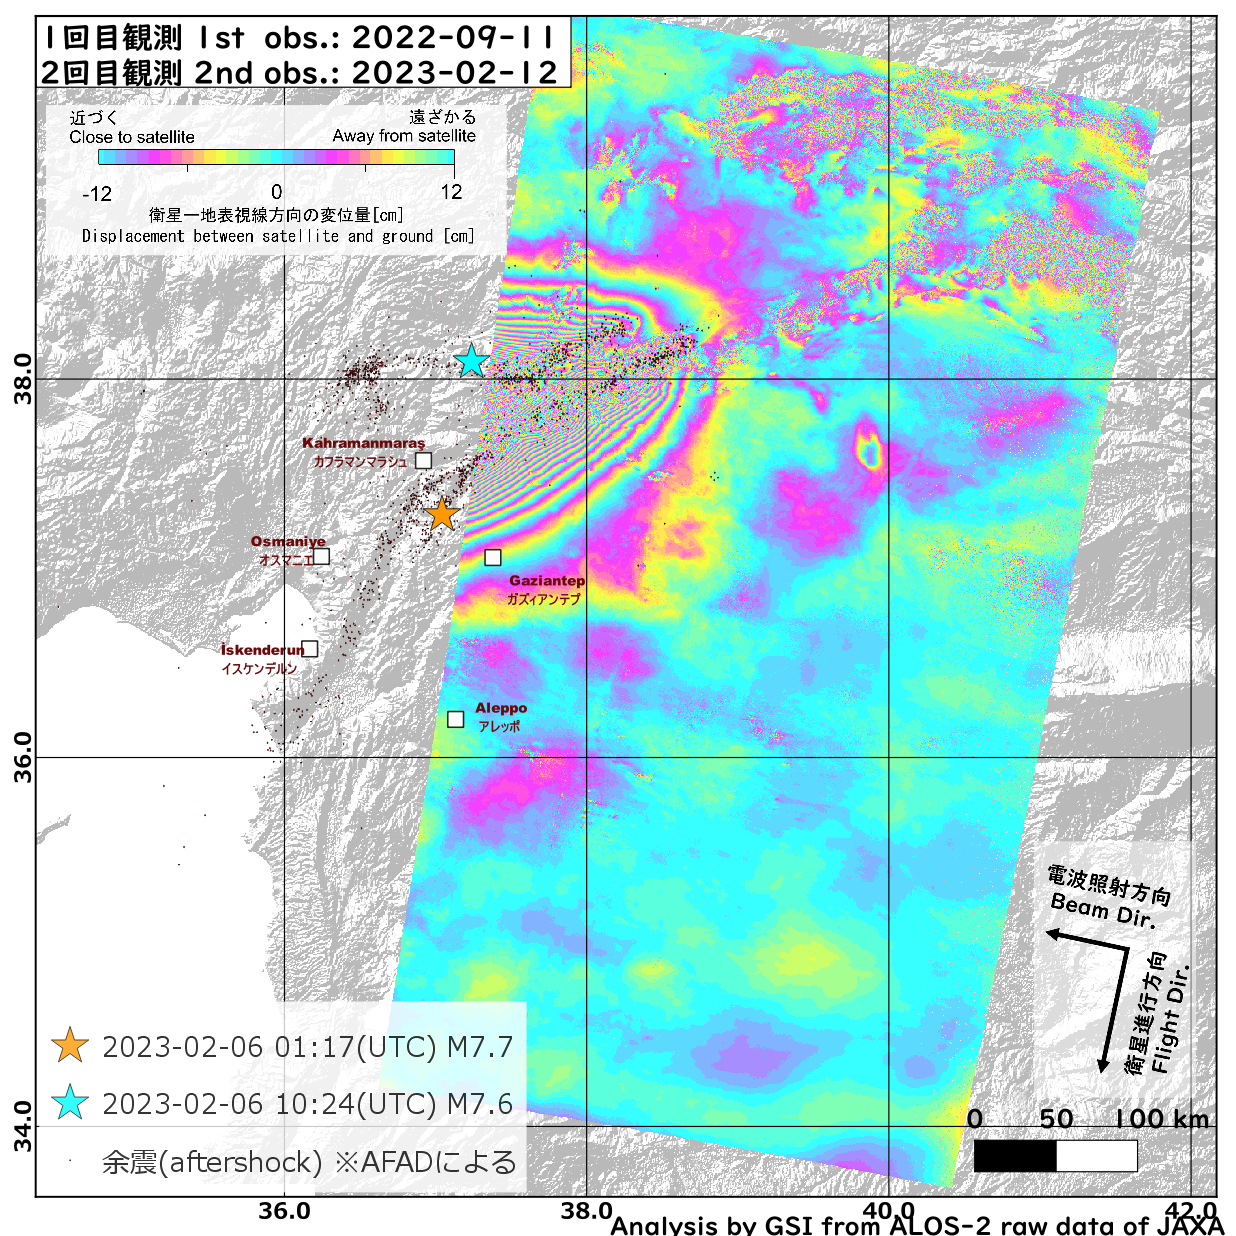
Fig. 12 SAR interferogram [PNG: 1MB]
Epicenter and aftershock distribution are from AFAD catalog.
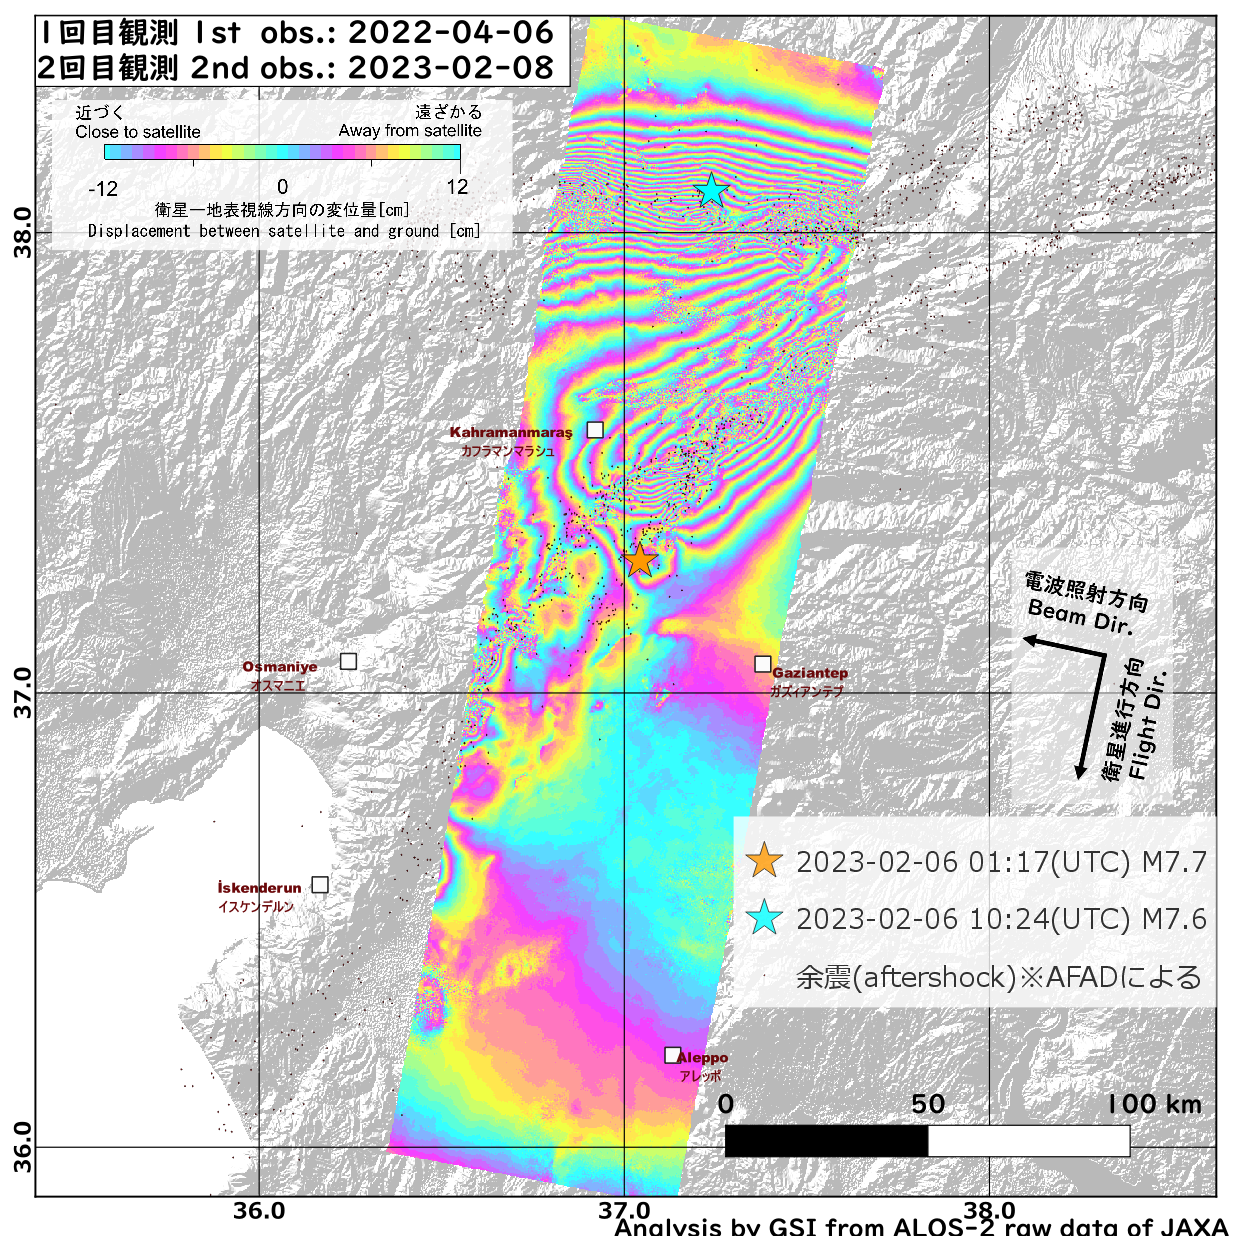
Fig. 13 SAR interferogram [PNG: 1MB]
Epicenter and aftershock distribution are from AFAD catalog.
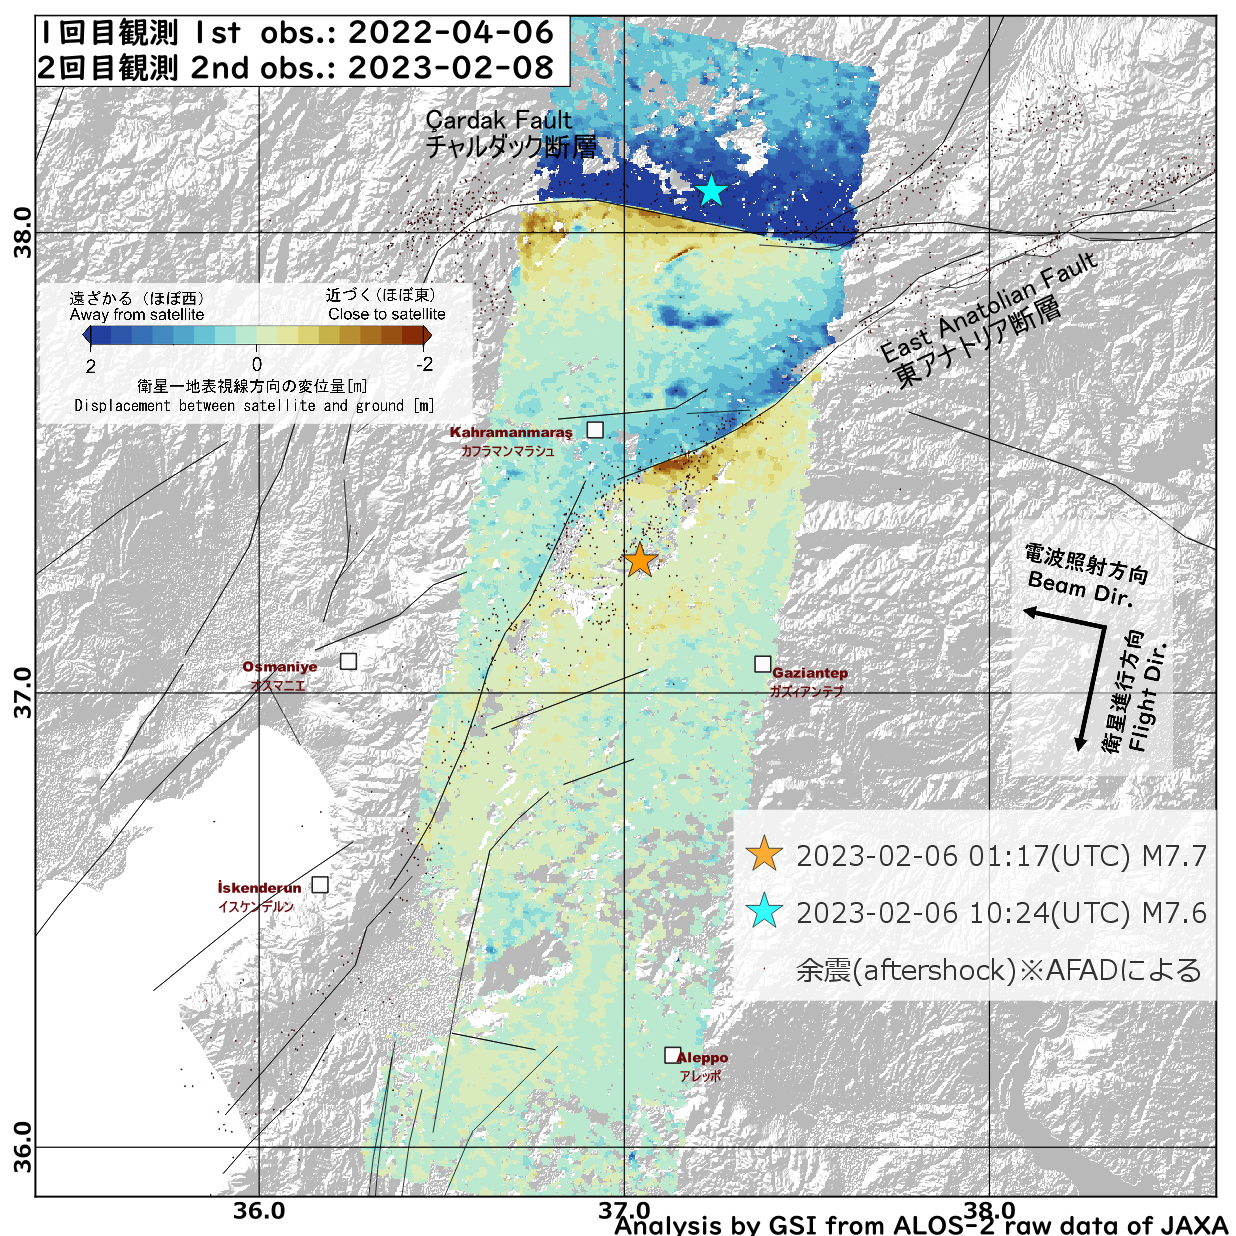
Fig. 14 Pixel offset method image(Beam Direction). [PNG: 1MB]
Epicenter and aftershock distribution are from AFAD catalog.
Fault lines are based on Styron et al. (2020)
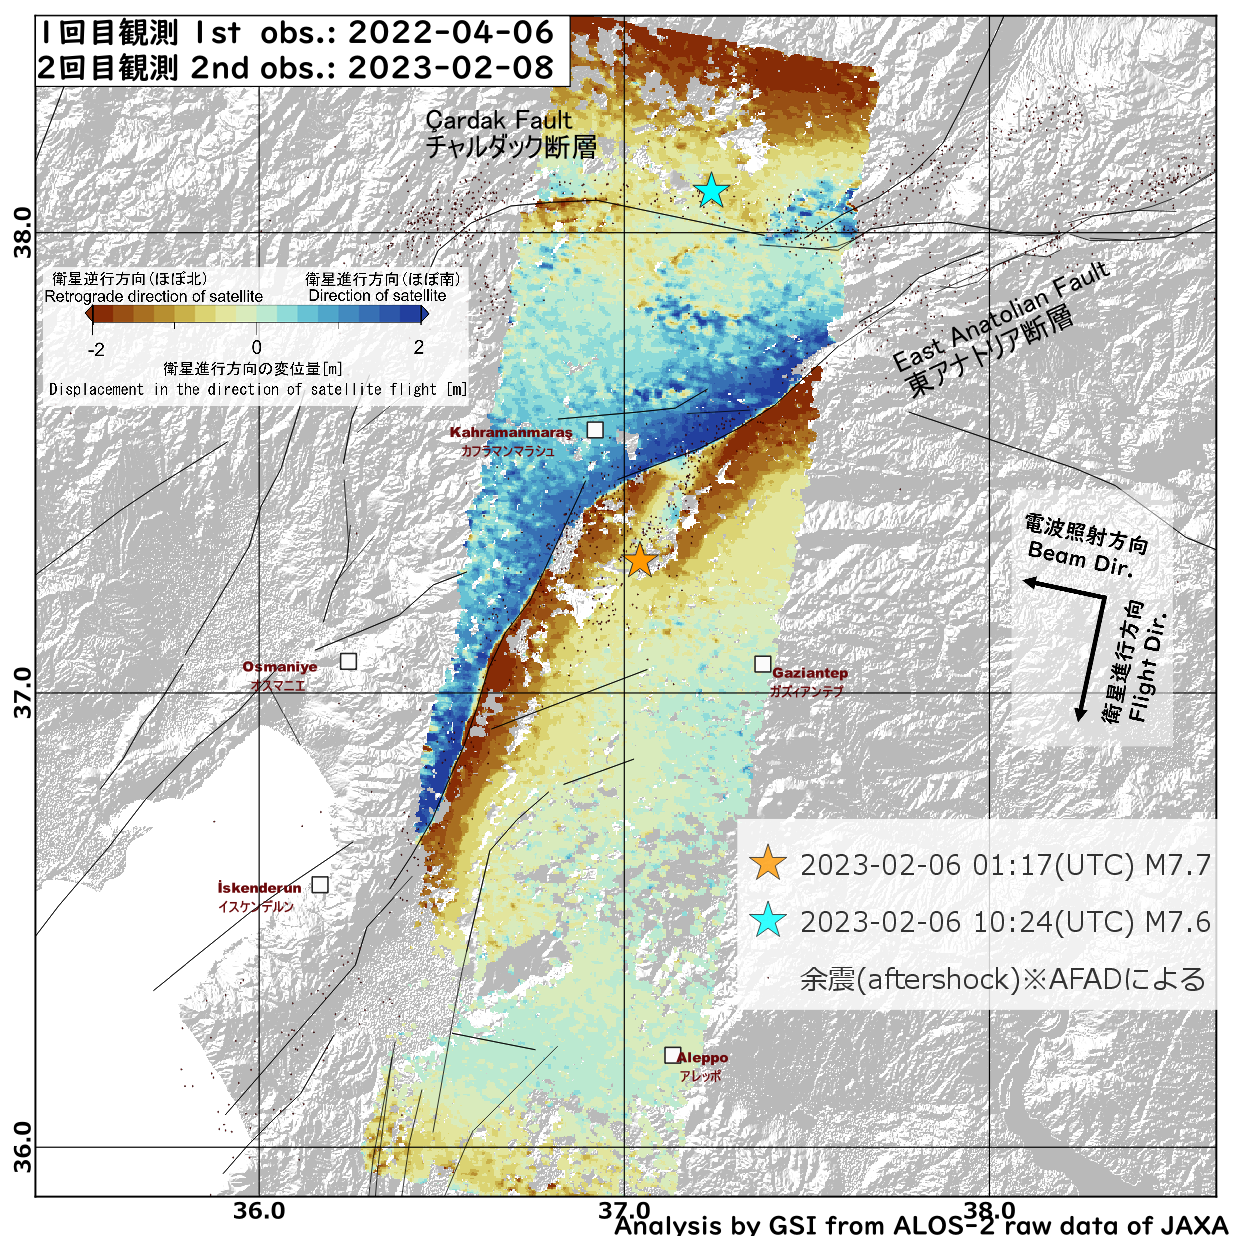
Fig. 15 Pixel offset method image(Flight Direction). [PNG: 1MB]
Epicenter and aftershock distribution are from AFAD catalog.
Fault lines are based on Styron et al. (2020)
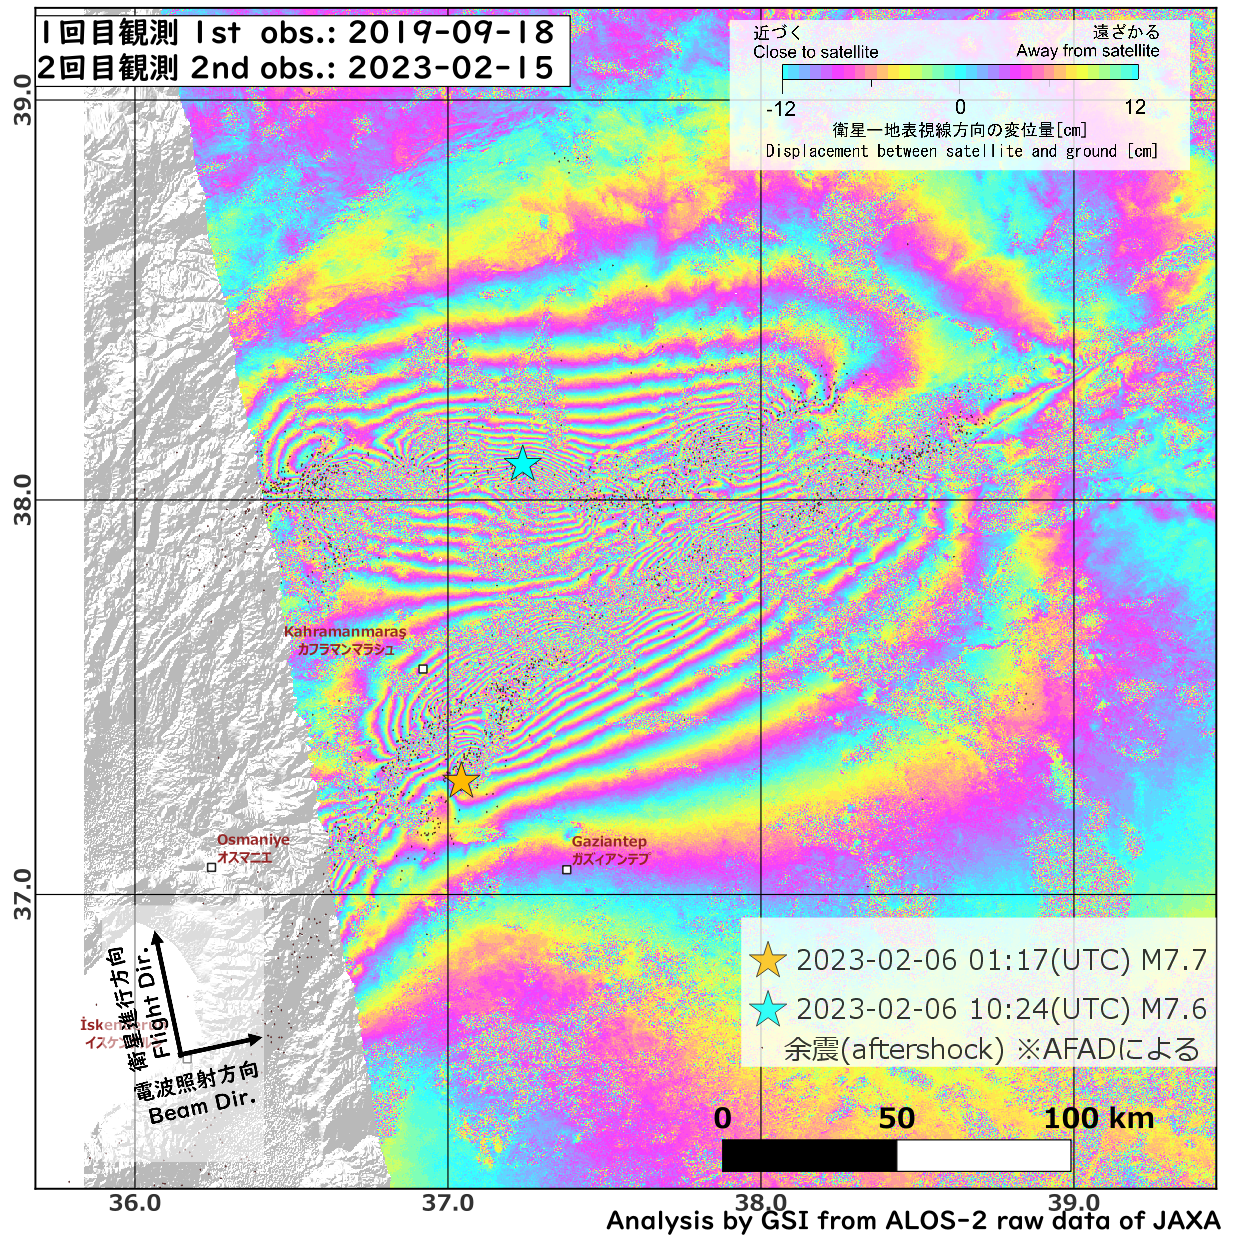
Fig. 16 SAR interferogram [PNG: 1MB]
Epicenter and aftershock distribution are from AFAD catalog.
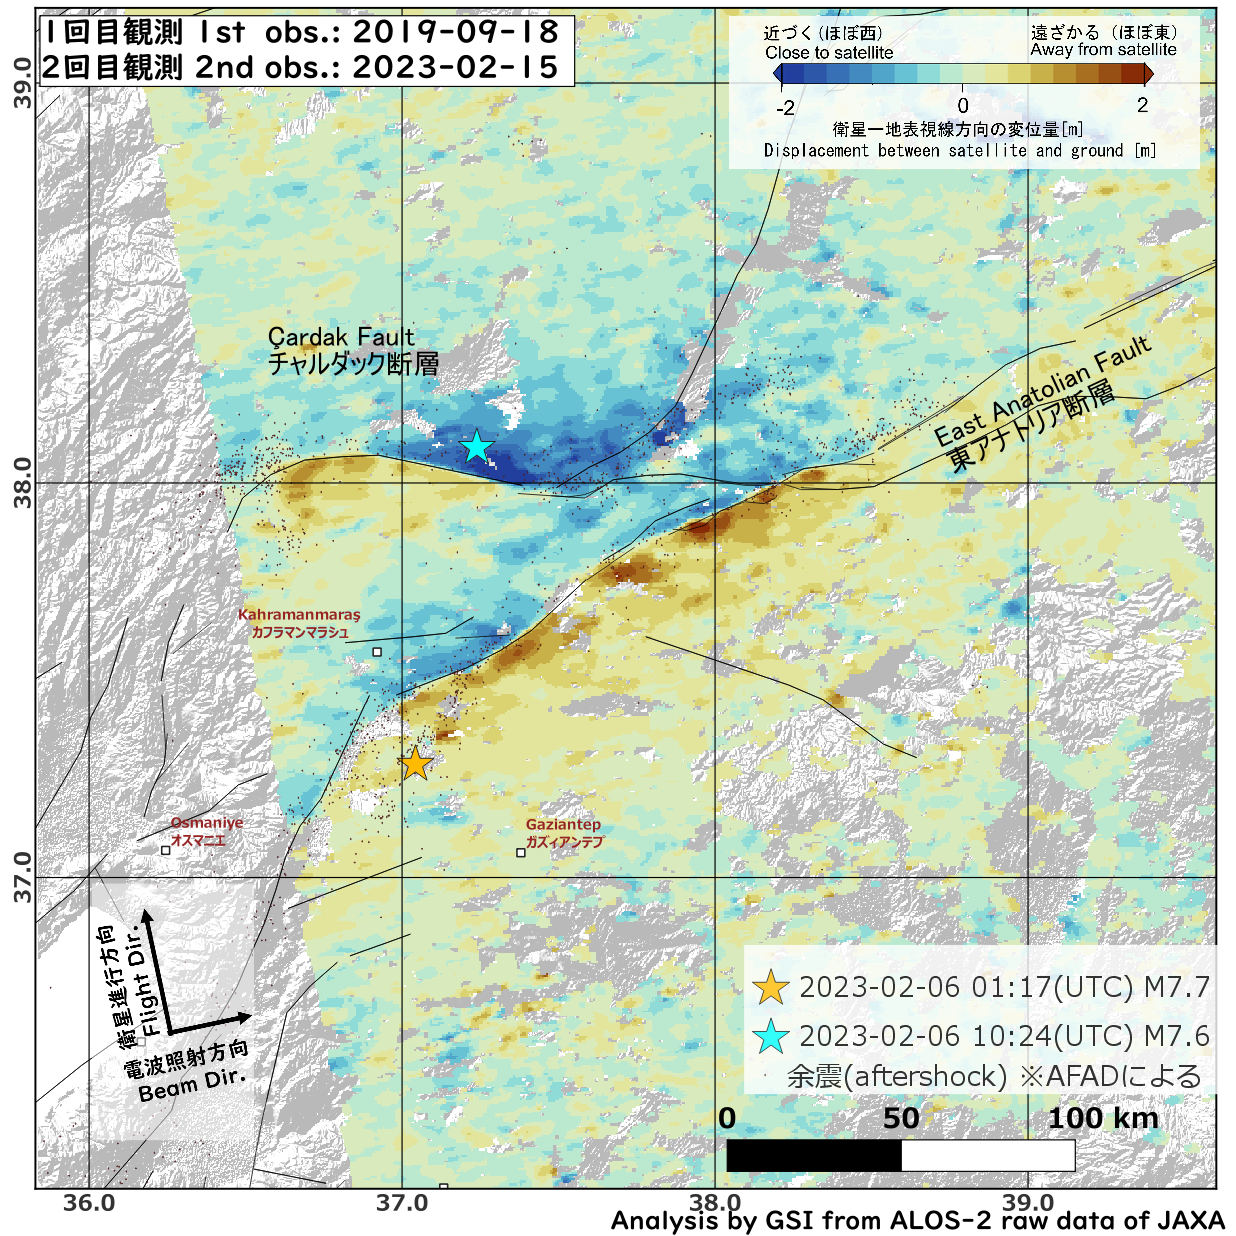
Fig. 17 Pixel offset method image(Beam Direction). [PNG: 1MB]
Epicenter and aftershock distribution are from AFAD catalog.
Fault lines are based on Styron et al. (2020)
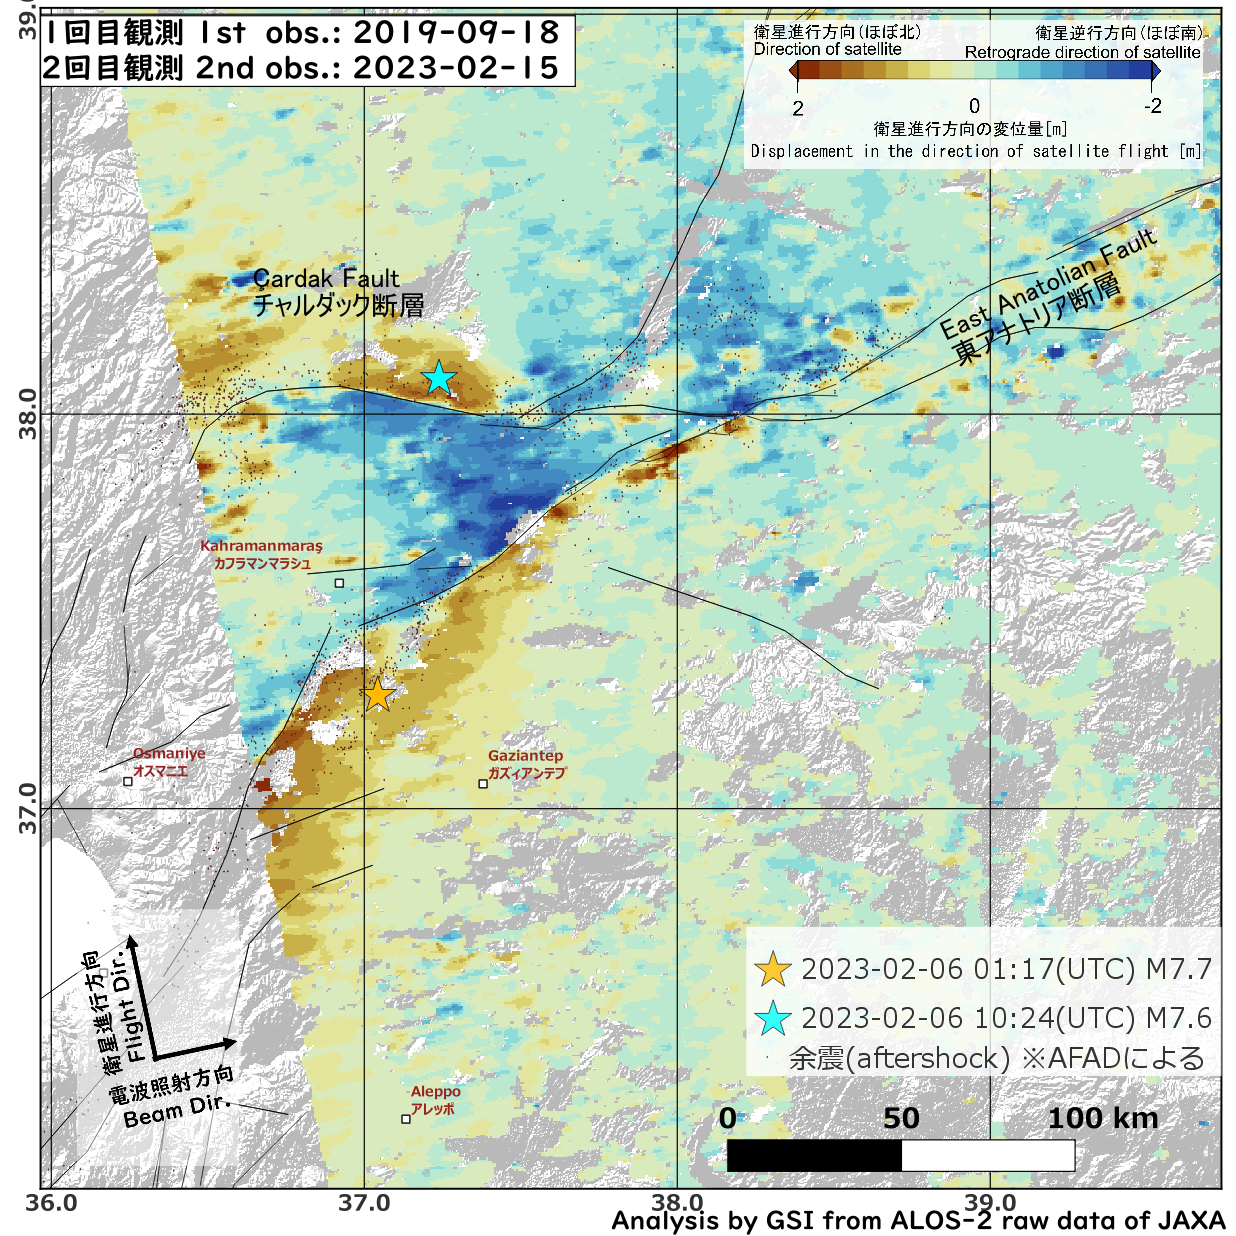
Fig. 18 Pixel offset method image(Flight Direction). [PNG: 1MB]
Epicenter and aftershock distribution are from AFAD catalog.
Fault lines are based on Styron et al. (2020)
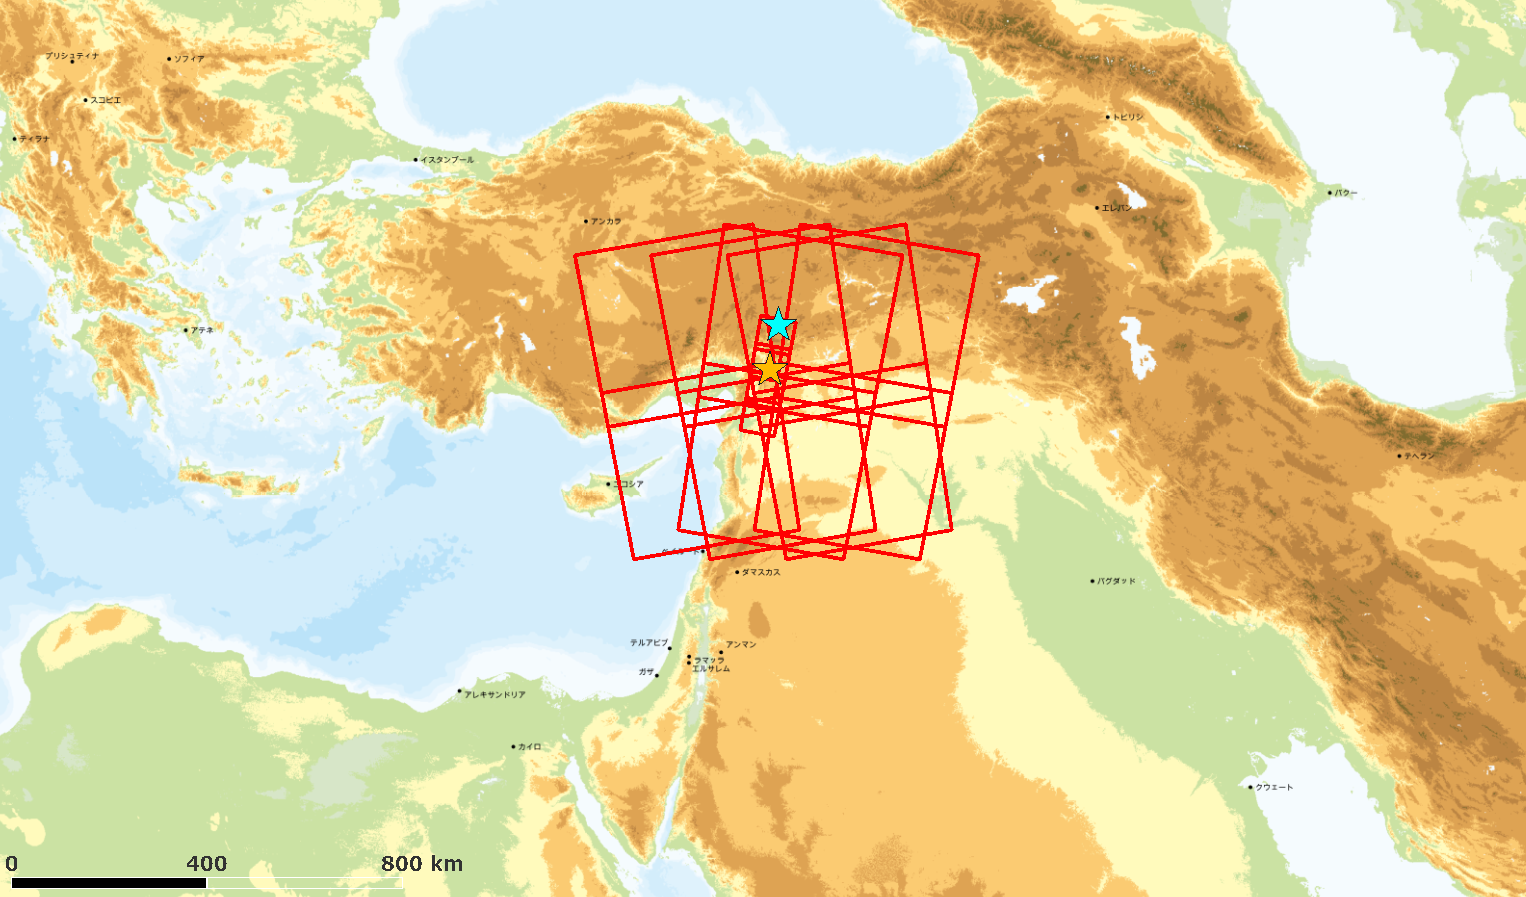
Fig. 19 range
Analysis by GSI from ALOS-2 data of JAXA.
These results were obtained through the activity of the SAR analysis working group of the Coordinating Committee for Earthquake Prediction.
The 2023 Turkey Earthquake
| Date-Time |
Feb. 6, 2023, 01:17(UTC) |
Hypocenter
Location |
37.288°N, 37.043°E, Depth:8.6km
(AFAD, as of Feb. 13, 2023) |
| Magnitude |
M=7.7
(AFAD, as of Feb. 13, 2023) |
| Date-Time |
Feb. 6, 2023, 10:24(UTC) |
Hypocenter
Location |
38.089°N, 37.239°E, Depth:7.0km
(AFAD, as of Feb. 13, 2023) |
| Magnitude |
M=7.6
(AFAD, as of Feb. 13, 2023) |
Satellite
ALOS-2 (Advanced Land Observing Satellite 2) launched by Japan Aerospace Exploration Agency on May 24, 2014
Copyrights and Credits
Copyright. Geospatial Information Authority of Japan. ALL RIGHTS RESERVED.
We welcome links from your website to this website. When using materials on this website, we ask that proper credit be given.
Contact
Geography and Crustal Dynamics Research Center
Crustal Deformation Research
MUNEKANE Hiroshi: Head of Division
[Reference information] Analysis results on February 9, 2023
Summary
M7.8 and M7.5 (USGS) earthquakes occurred in Turkey on February 6, 2023 (UTC). To measure the crustal deformation caused by this earthquake, we applied interferometric and pixel offset analysis using ALOS-2/PALSAR-2 data. The analysis clearly revealed the spatial distribution of crustal deformation.
- The observed crustal deformation is consistent with that expected for a left-lateral fault.
- Crustal deformation is observed along the East Anatolian Fault.
- In some areas in the proximity of the above fault zone, incoherent phases are observed. The ground surface may have been altered by the earthquake in these areas.
- A crustal deformation reaching 2 m was observed in the direction of approaching/away from satellite.
InSAR pair
Fig.
# |
Date |
Time
(UTC) |
Flight
Dir. |
Beam
Dir. |
Obs.
Mode *1 |
Incidence Angle
(around epicenter) |
Bperp |
| 1,2 |
2022-04-06
2023-02-08 |
9:40 |
Des. |
Right |
F-F
(10m) |
31.7° |
-435m |
*1 F: Stripmap (Fine)
(cf. ALOS-2 Project / PALSAR-2 (JAXA))
SAR Interferograms
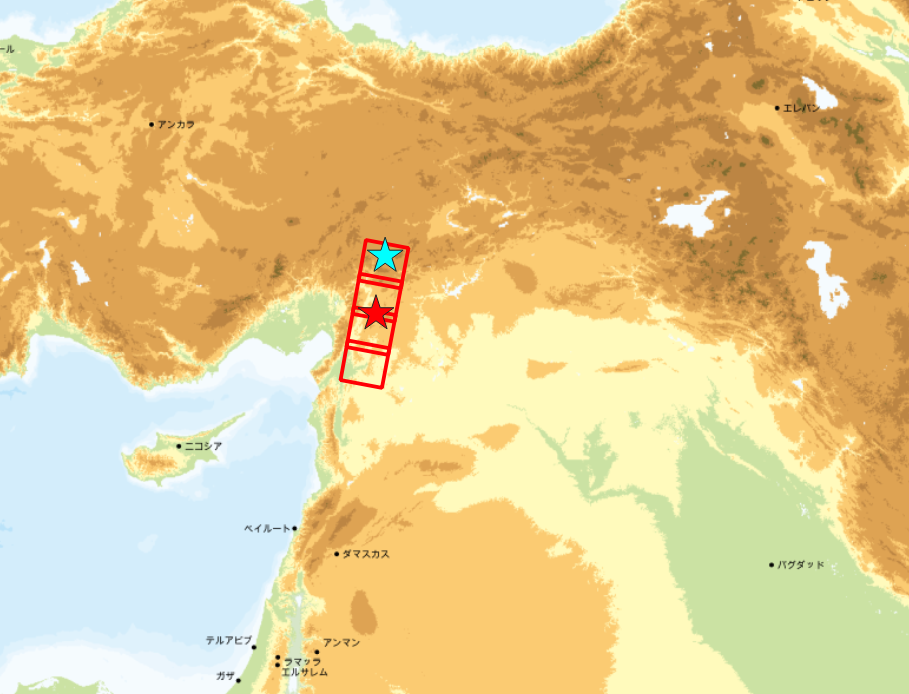
Fig. 3 range
Analysis by GSI from ALOS-2 data of JAXA.
These results were obtained through the activity of the SAR analysis working group of the Coordinating Committee for Earthquake Prediction.
The 2023 Turkey Earthquake (Sourced by USGS)
| Date-Time |
Feb. 6, 2023, 01:17(UTC) |
Hypocenter
Location |
37.174°N, 37.032°E, Depth:17.9km
(USGS, as of Feb. 9, 2023) |
| Magnitude |
M=7.8
(USGS, as of Feb. 9, 2023) |
| Date-Time |
Feb. 6, 2023, 10:24(UTC) |
Hypocenter
Location |
38.024°N, 37.203°E, Depth:10.0km
(USGS, as of Feb. 9, 2023) |
| Magnitude |
M=7.5
(USGS, as of Feb. 9, 2023) |
|