

The 2016 Central Tottori Earthquake
3D Crustal Deformation Revealed by SARReleased: Oct. 27, 2016, Japanese version of this page
Updated: Nov. 14, 2016 (Rectangular fault model) OverviewAn earthquake (Mj6.6) occurred in central Tottori Prefecture in Japan on October 21, 2016. Three dimensional crustal deformation caused by the earthquake has been revealed by using ALOS-2/PALSAR-2 data.A fault model was also estimated from the deformation observed by InSAR and GNSS.
The results obtained from the data are summarized as follows.
* Note that these results are possibly updated with further elaborated analyses. 3D InSAR analysisALOS-2 InSAR results have shown crustal deformation caused by the earthquake (Information about the 2016 Central Tottori Earthquake, in Japanese). Although this standard InSAR have only one dimensional measuring capability, full three dimensional (3D) deformation can be retrieved using three or more independent results with different observing directions (Fig. 2). In this case, four independent InSAR results were used for the 3D InSAR analysis.
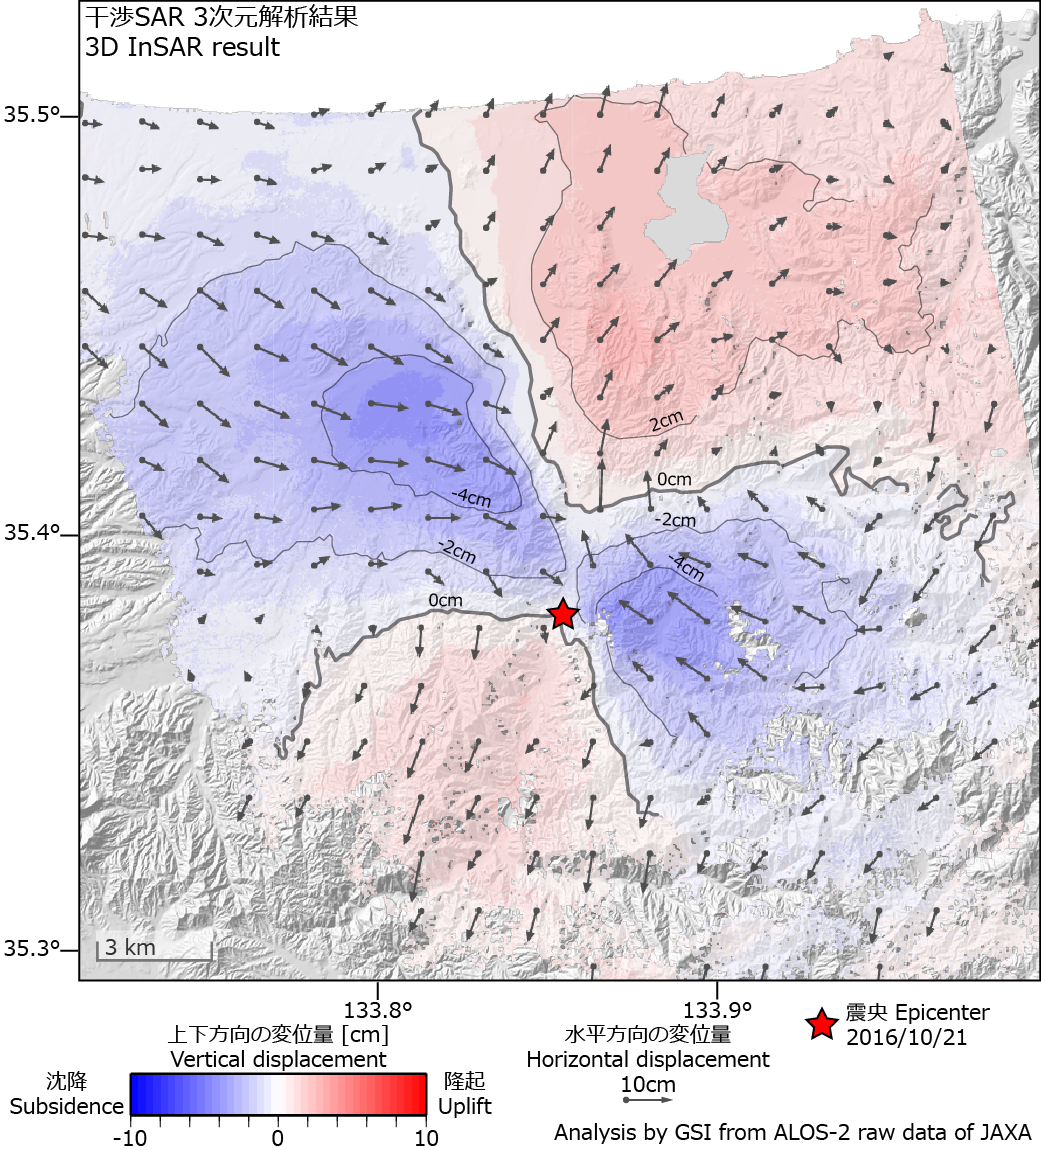
The 3D InSAR result reveals clear 3D crustal deformation with high spatial resolution. The pattern of the vertical (color) and horizontal (vector) displacement shown in Fig. 1 strongly suggests a left-lateral fault motion with the strike of NNW – SSE direction. 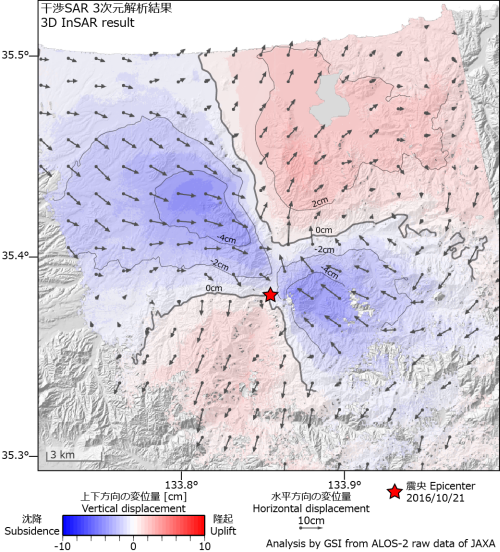 [PNG: 998KB] [View on GSIMaps (in Japanese)] [PNG: 998KB] [View on GSIMaps (in Japanese)]Fig. 1. 3D displacement revealed by 3D InSAR 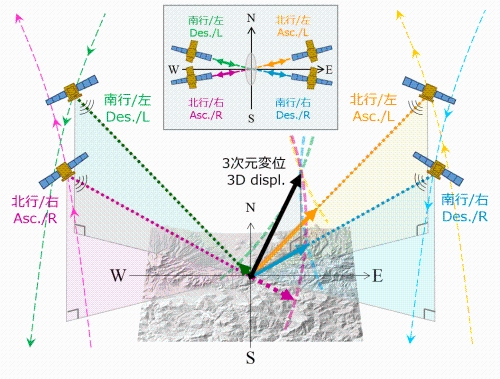 Fig. 2. Geometry of 3D InSAR Analyzed by GSI from ALOS-2 raw data of JAXA. These results were obtained through the activity of the SAR analysis working group of the Coordinating Committee for Earthquake Prediction. Rectangular Fault ModelUpdated: Nov. 14, 2016
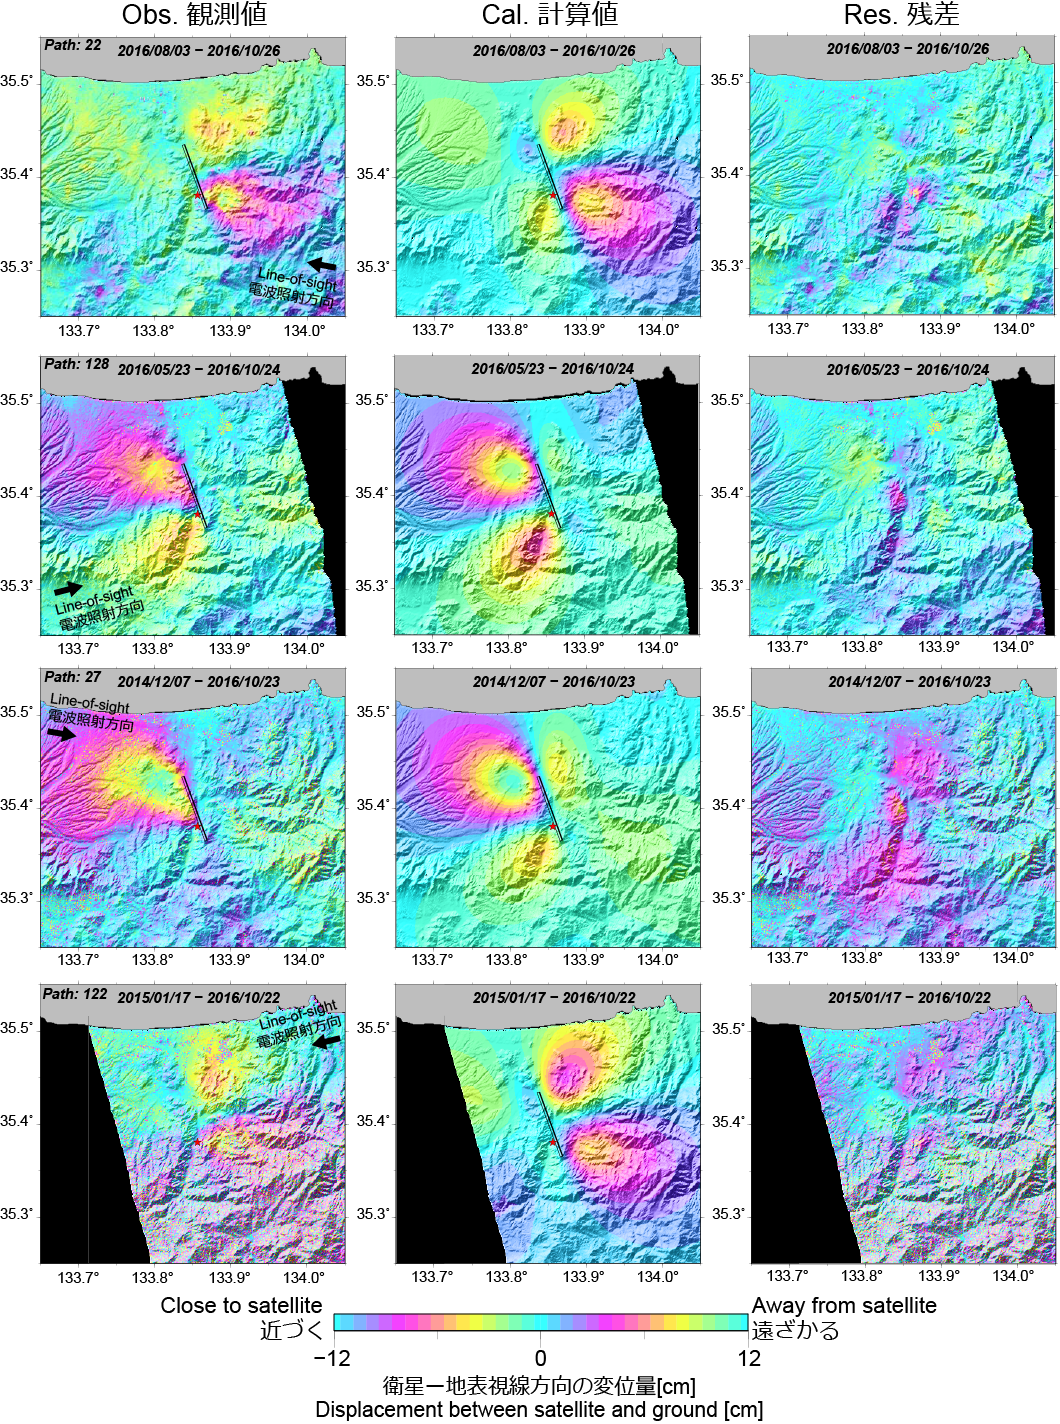
The estimated rectangular fault model with uniform slip from the InSAR and GNSS observations shows a high-angle left lateral fault motion with the strike of NNW – SSE direction. 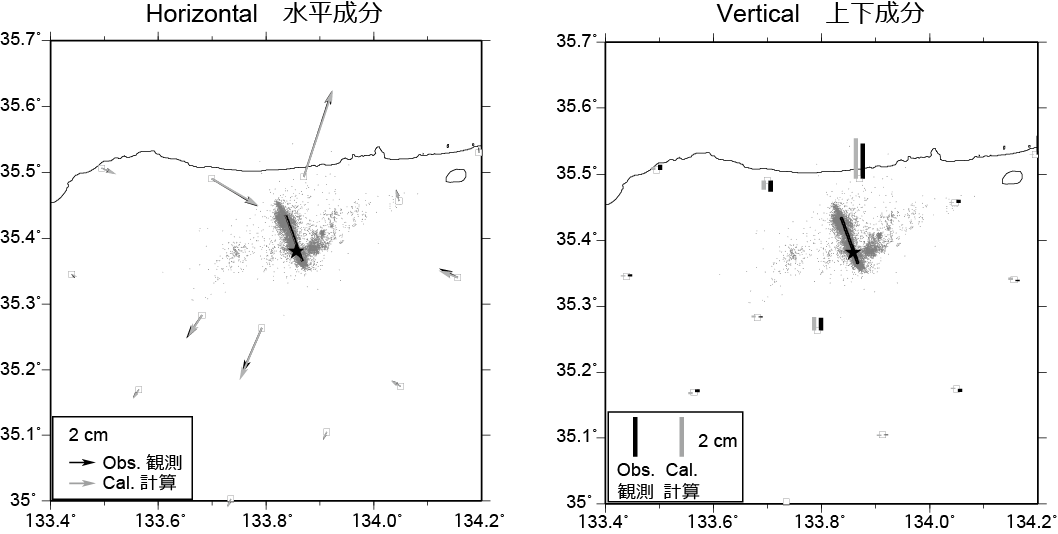 Fig. 3. Observed and calculated deformation by GNSS. Sold lines, stars and gray dots represent the upper location of the estimated fault, the epicenter, and aftershocks on October 21 – 27, 2016 by JMA, respectively.  [PNG: 202MB] [PNG: 202MB]Fig. 4. Displacement seen in four InSAR images, (left) observed, (middle) calculated, and (right) residual. Solid lines and red stars represent the upper location of the estimated fault and the epicenter, respectively.
The 2016 Central Tottori Earthquake
SatelliteALOS-2 (Advanced Land Observing Satellite 2) launched by Japan Aerospace Exploration Agency on May 24, 2014
Paper, Report, PresentationIn preparation
Copyrights and CreditsCopyright. Geospatial Information Authority of Japan. ALL RIGHTS RESERVED.
We welcome links from your website to this website. When using materials on this website, we ask that proper credit be given. ContactYARAI Hiroshi : Head of Division
KOBAYASHI Tomokazu : Chief Researcher MORISHITA Yu : Researcher 
Link
|