
The 2017 Iran-Iraq Earthquake: Crustal deformation detected by ALOS-2 data
Crustal Deformation Observed by Synthetic Aperture Radar (SAR)Released: Nov. 15, 2017, Last updated: Mar. 5, 2018 Japanese version of this page
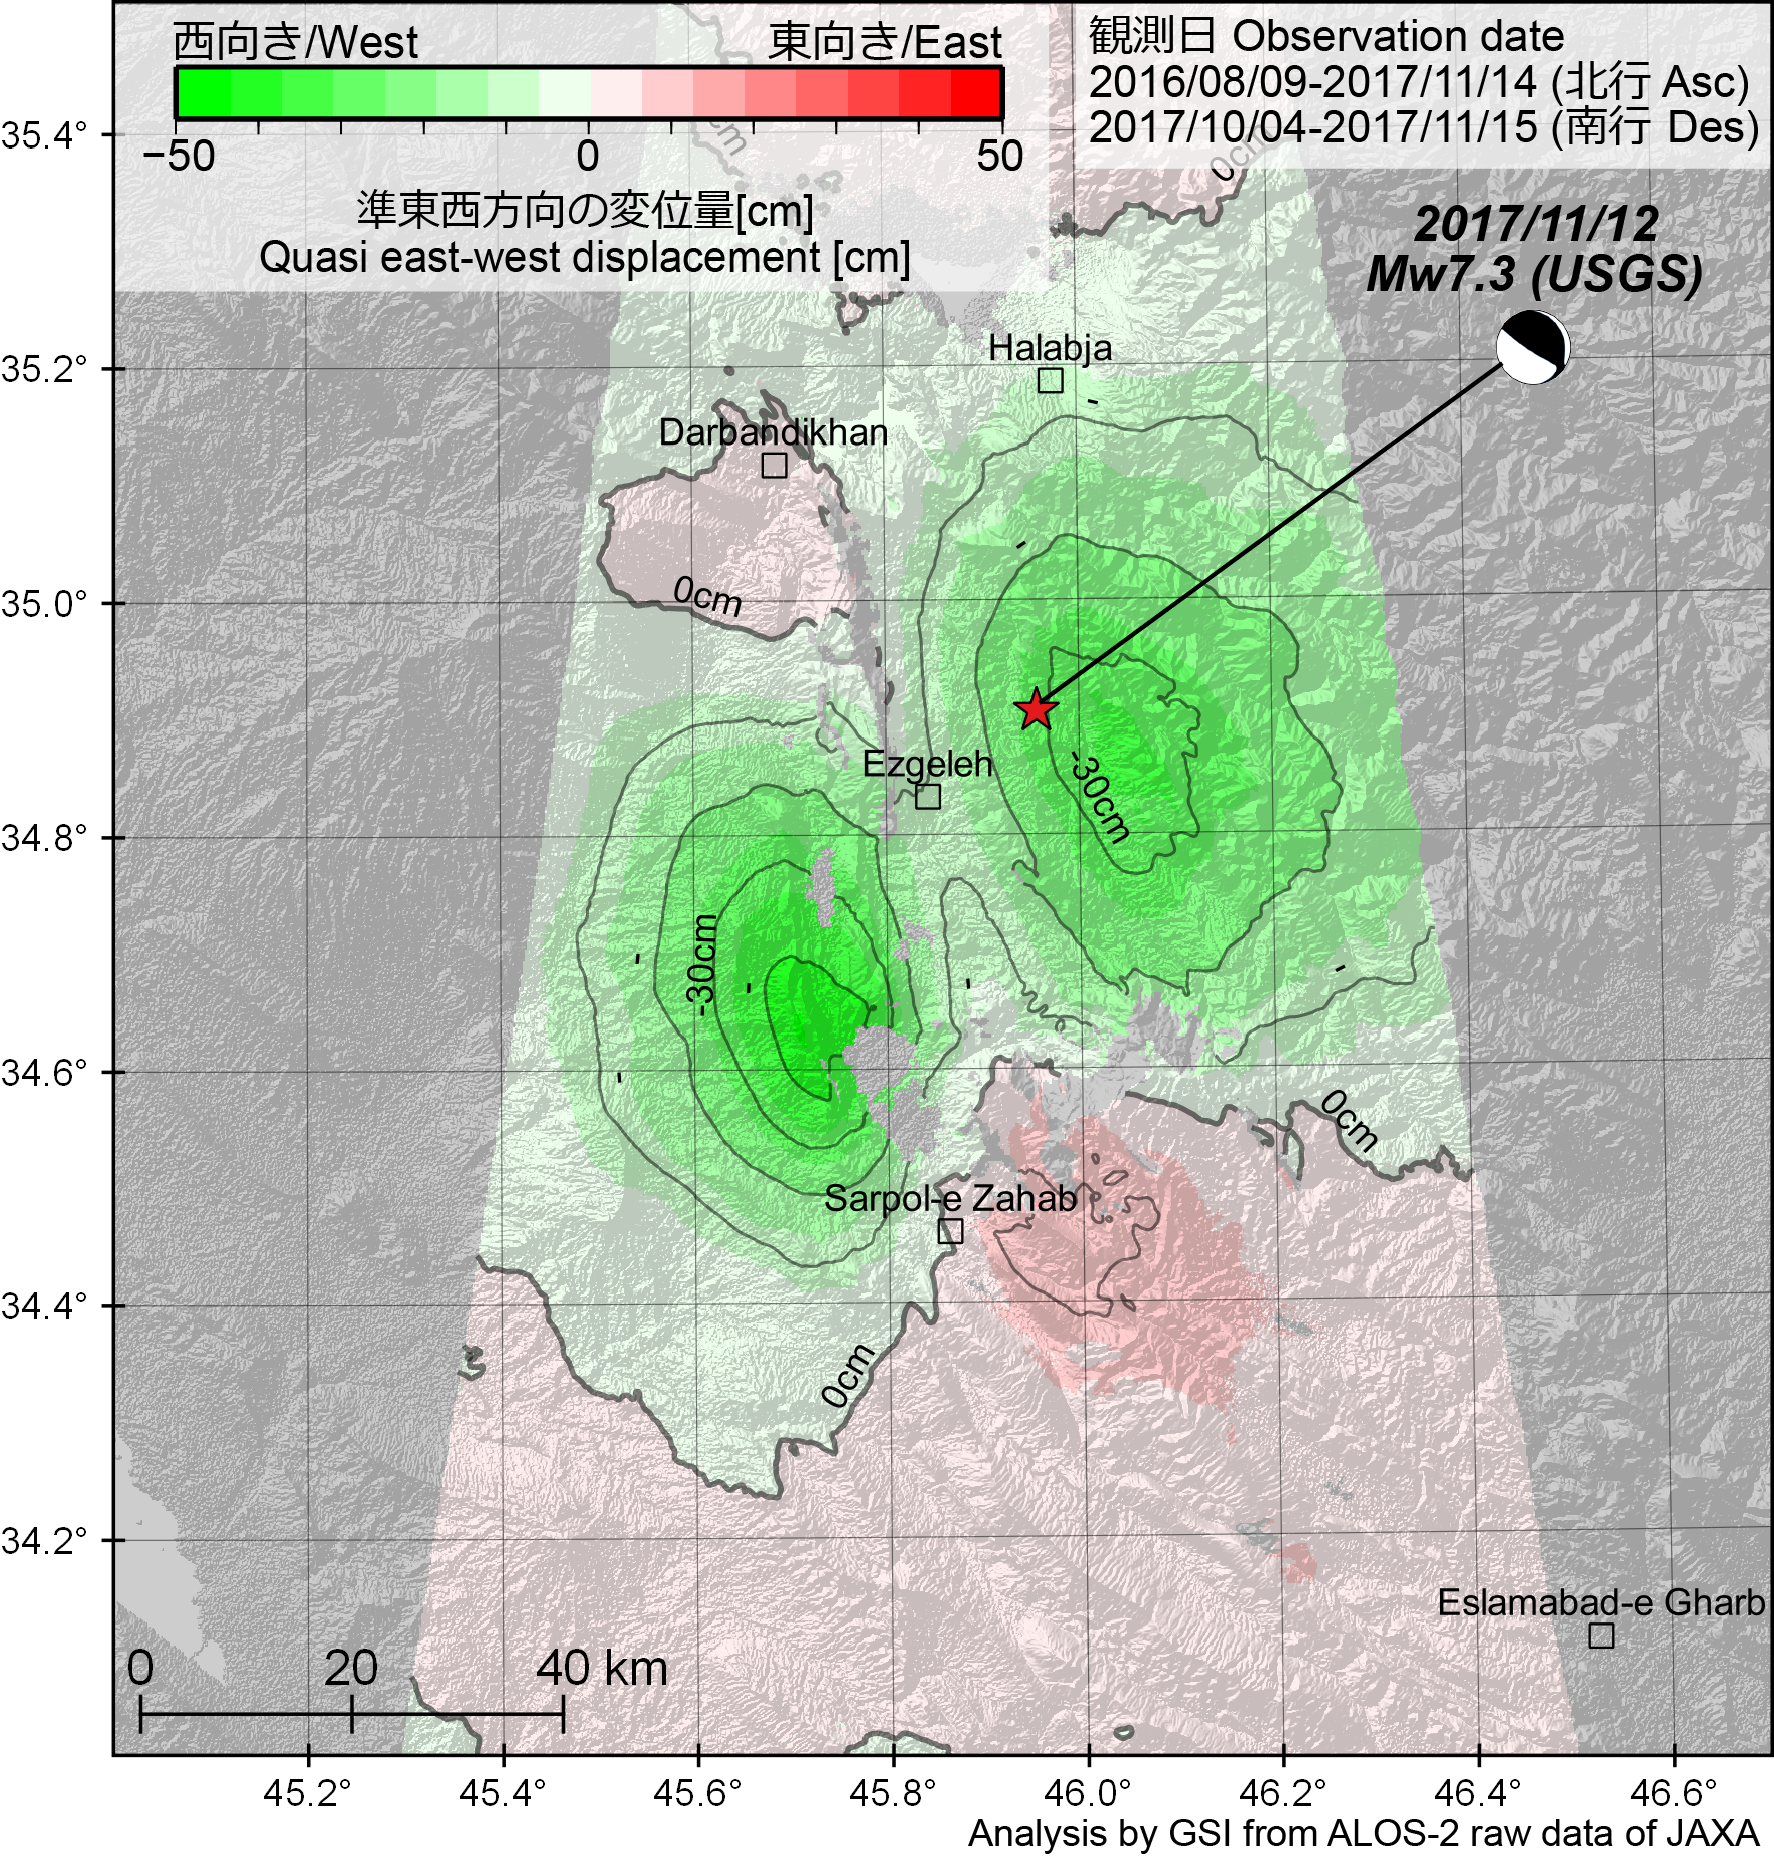
SummaryA large earthquake (Mw 7.3, USGS) occurred near the Iran-Iraq border on November 12, 2017. Serious damage such as building collapse and many deaths (> 500) has been reported around the epicenter. To measure the crustal deformation caused by the earthquake, we applied interferometric analysis using ALOS-2/PALSAR-2 data.
The results obtained from the data are summarized as follows. [Features of the crustal deformation]
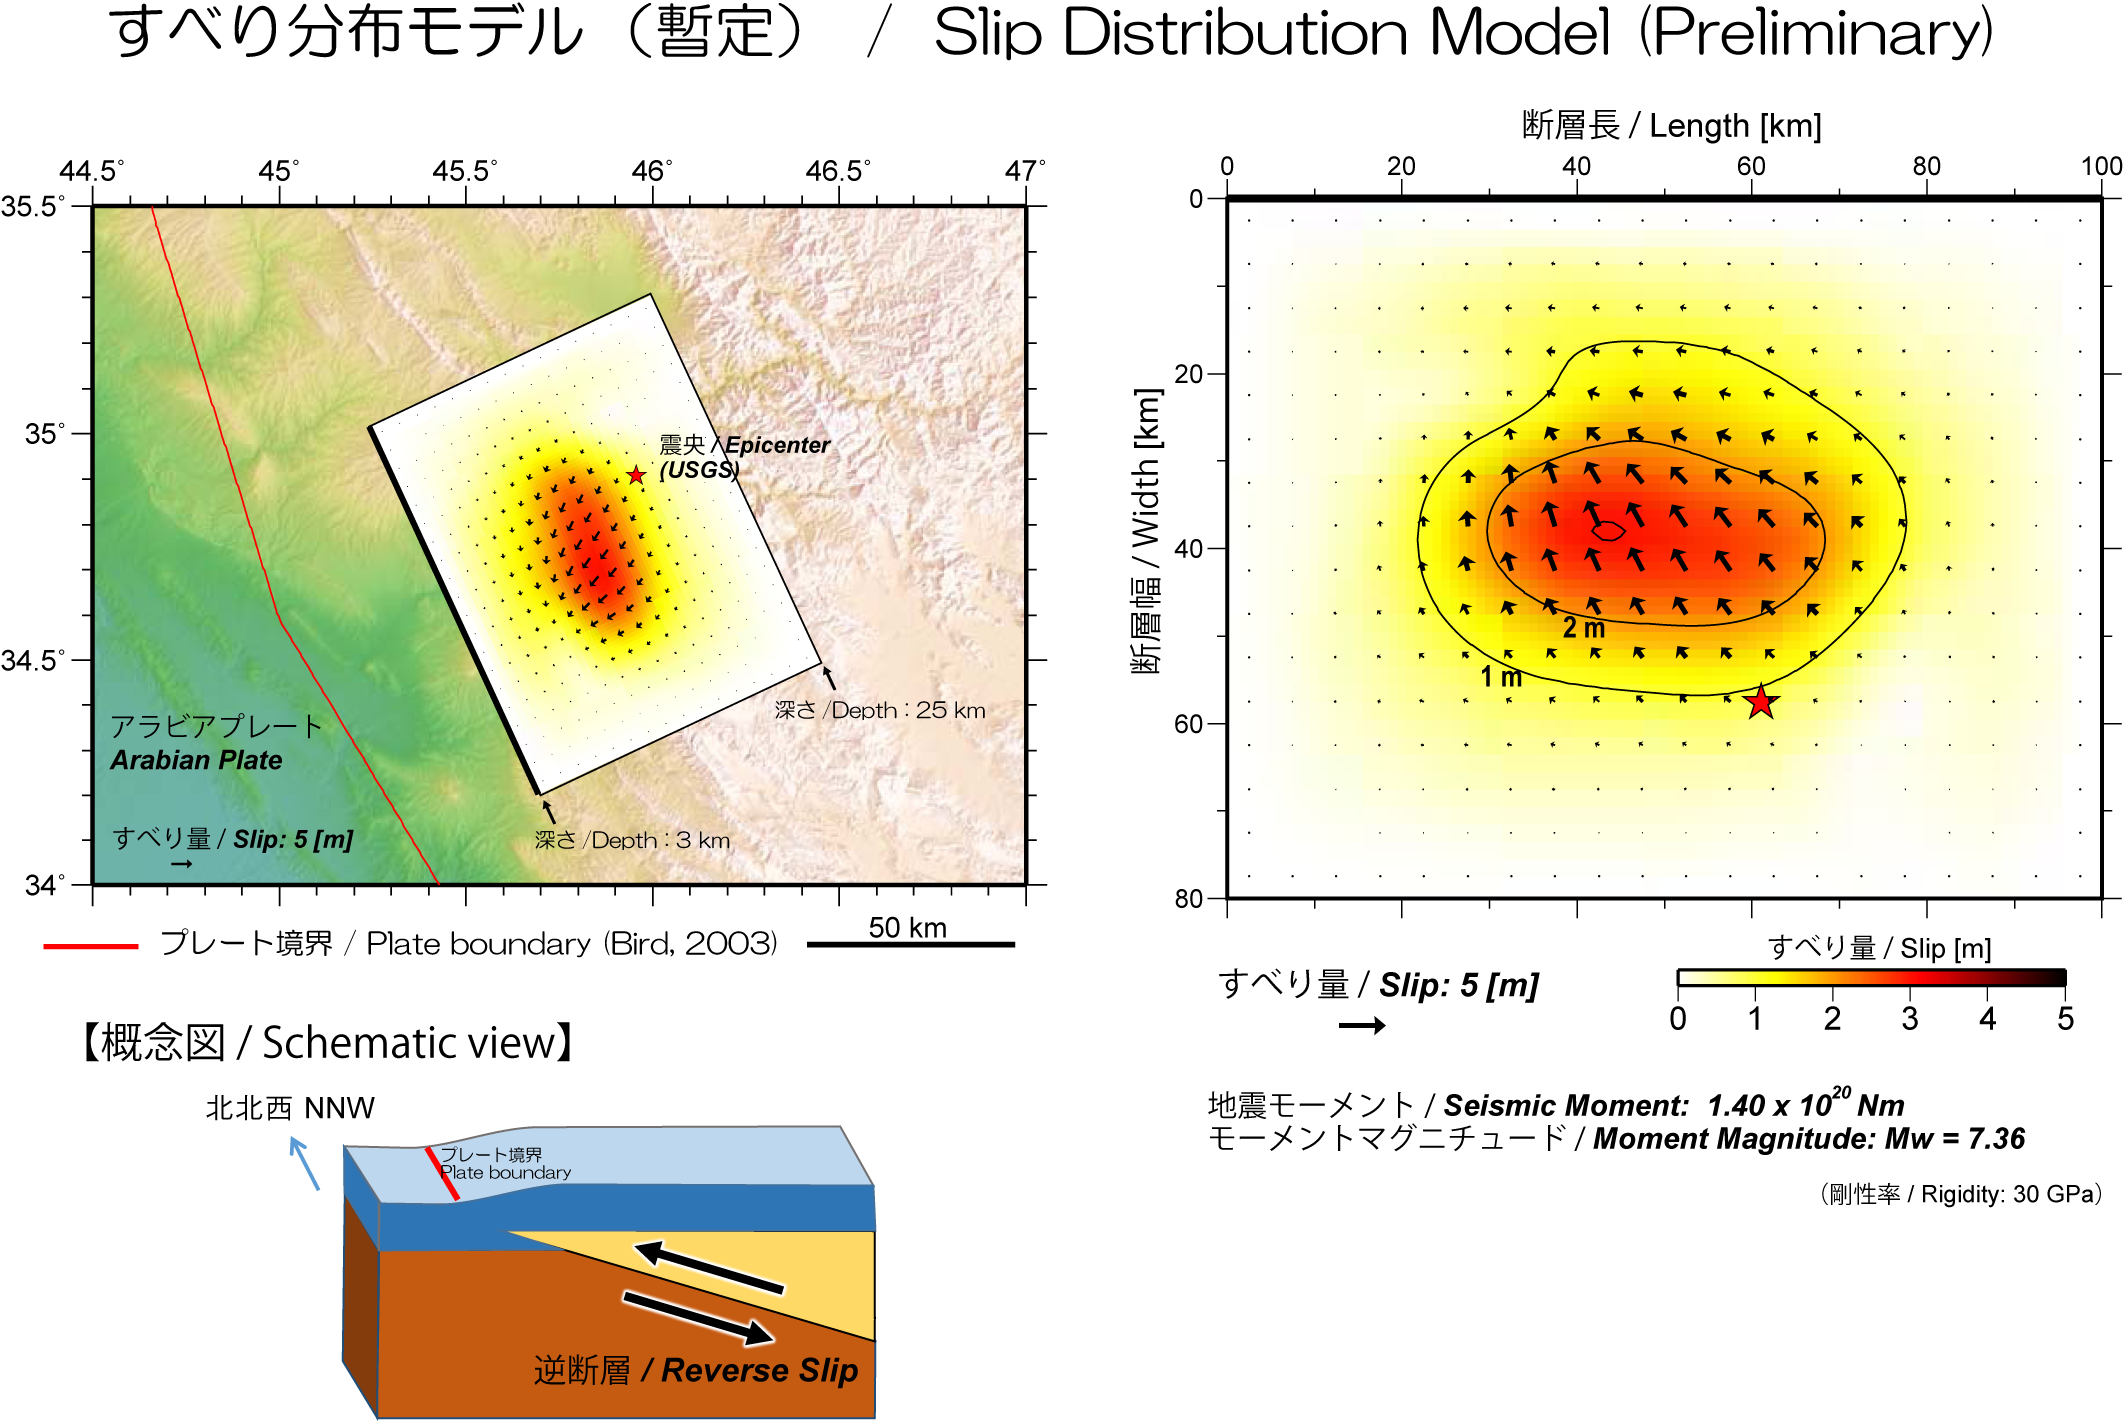
[Fault model]
Quasi up-down and east-west components of displacement
Fig. 1. Quasi UD [PNG: 2.67MB] [KMZ: 151KB]
Fig. 2. Quasi EW [PNG: 2.71MB] [KMZ: 155KB] 2.5-D analysis Two or more line-of-sight displacements with different observing directions (Figs. 4 and 5) can be decomposed to quasi up-down and east-west components. 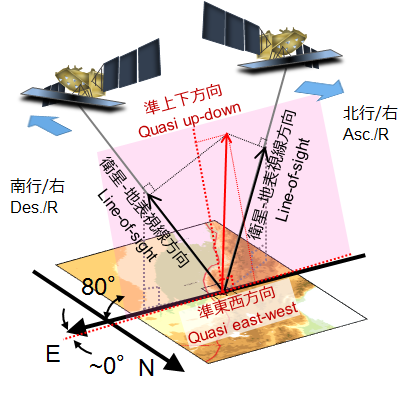 Fig. 3. Geometry of 2.5-D analysis SAR Interferograms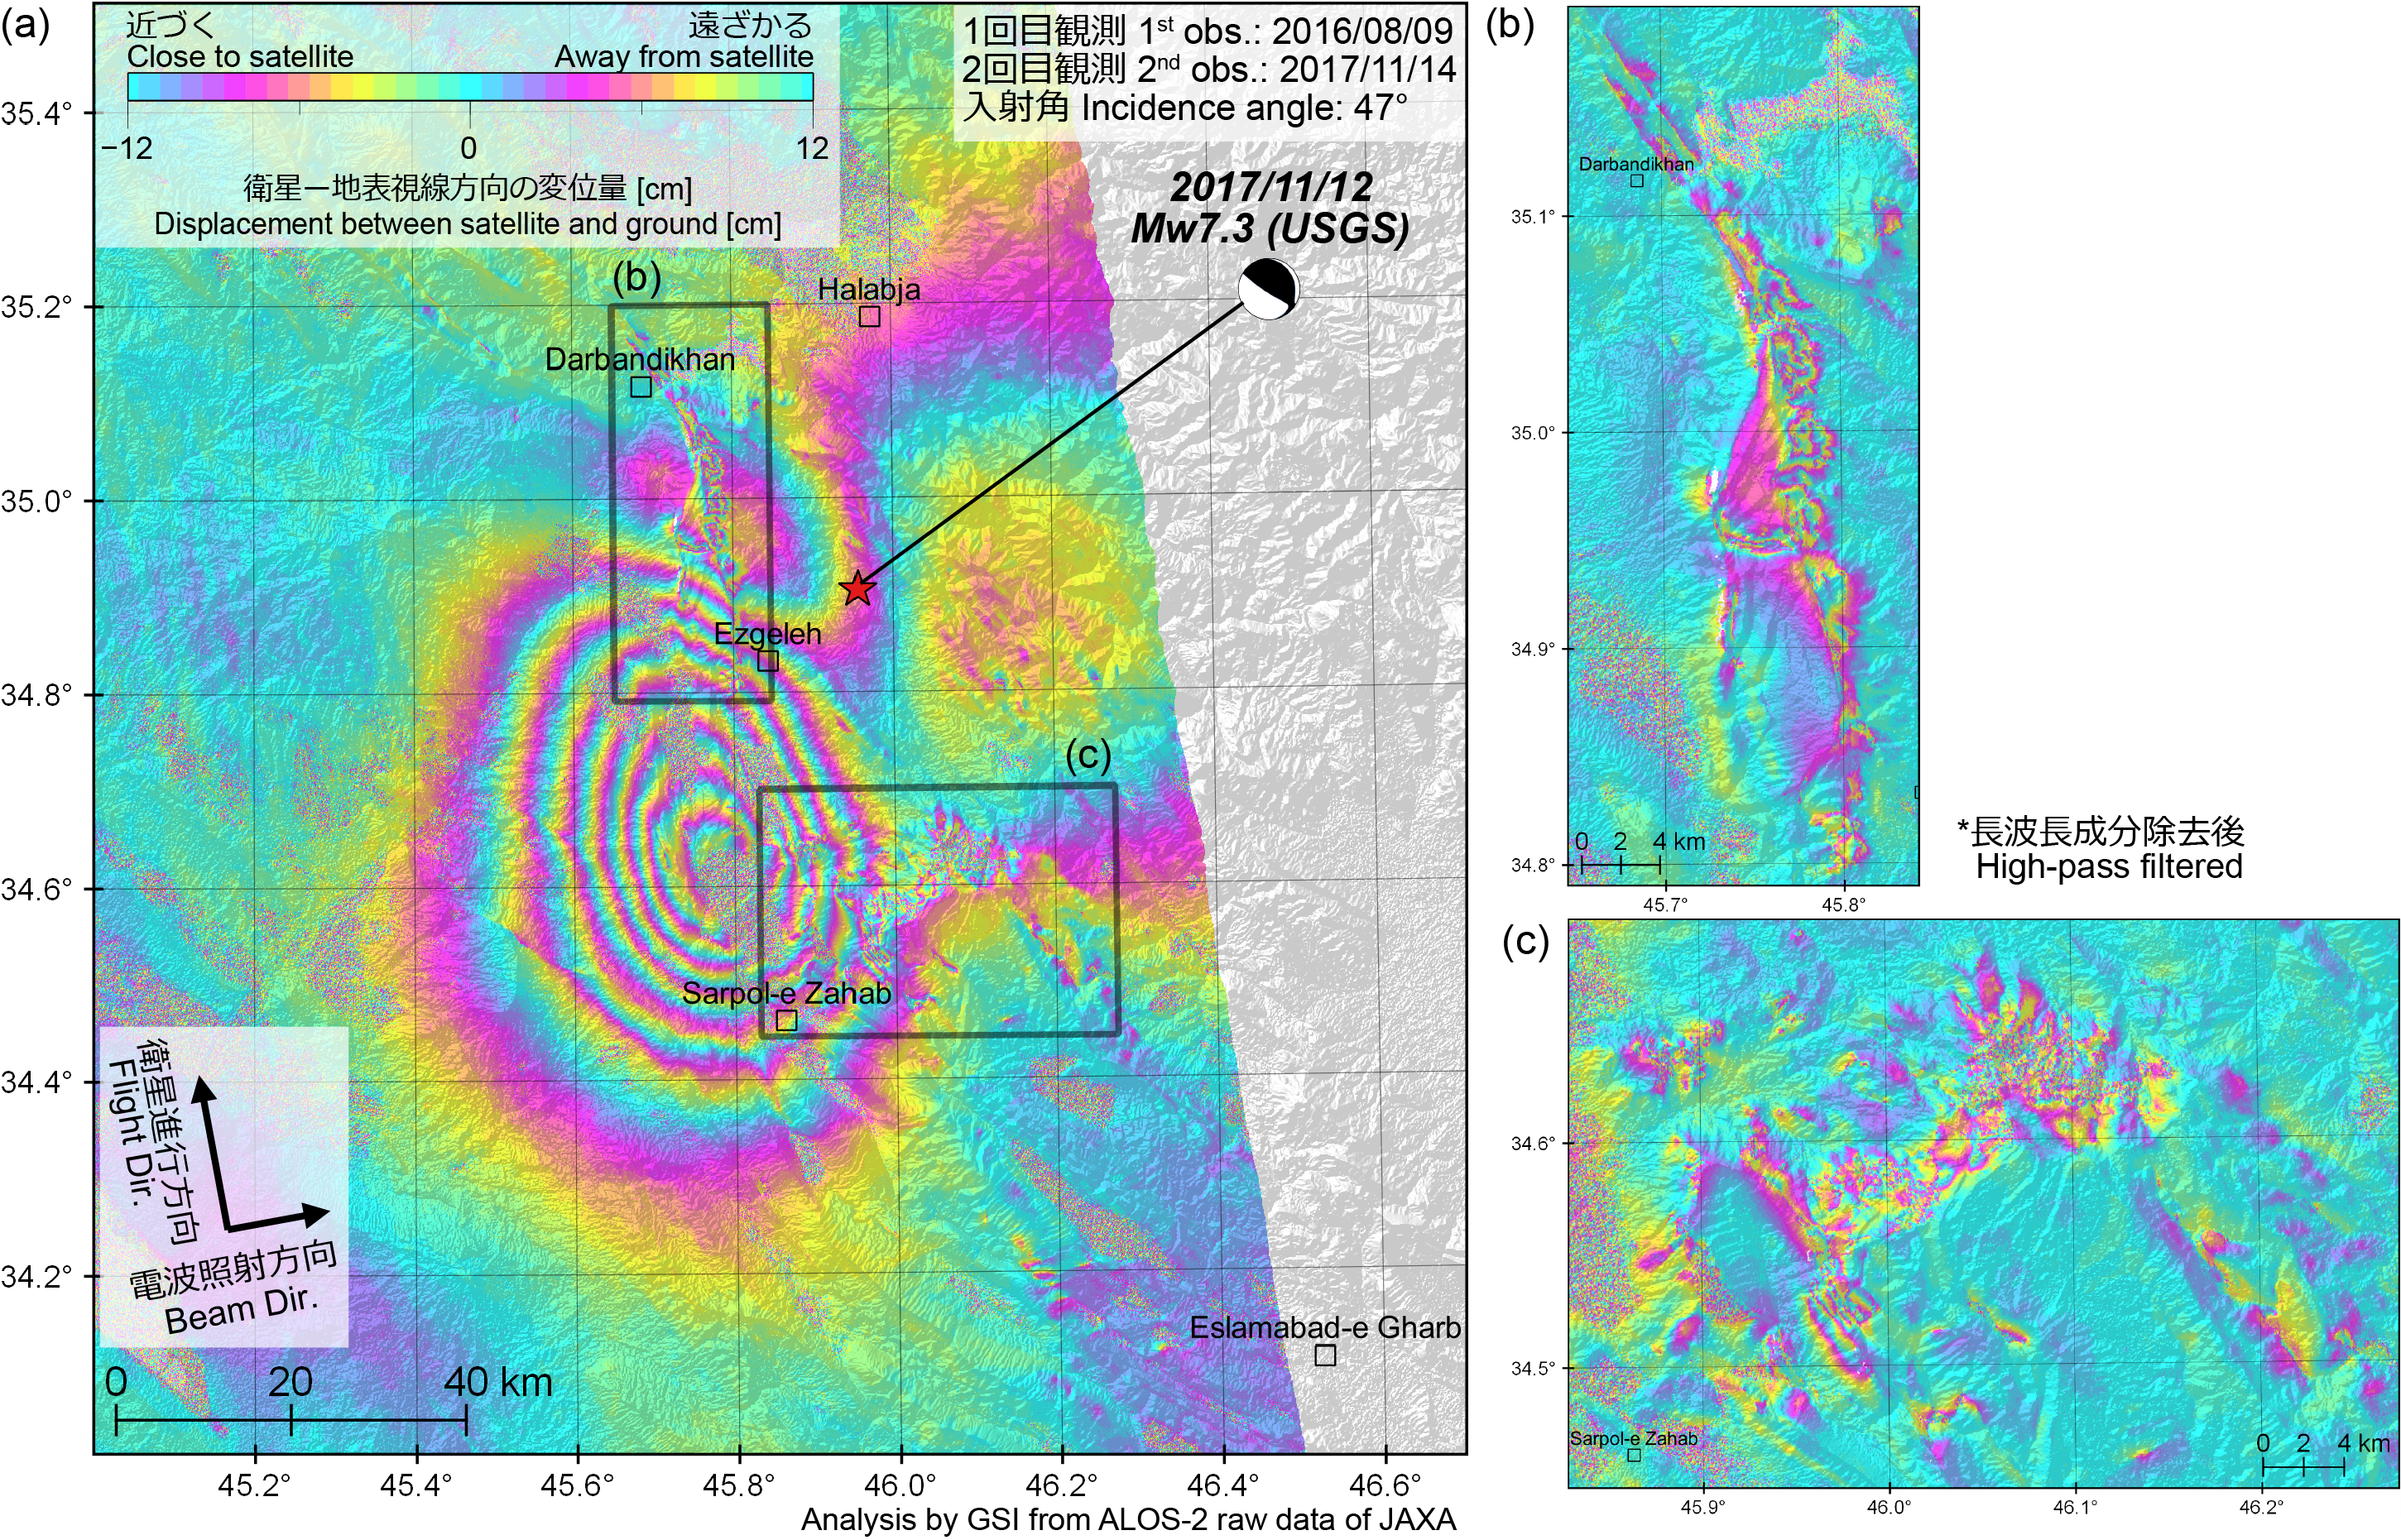
Fig. 4. [PNG: 6.72MB]
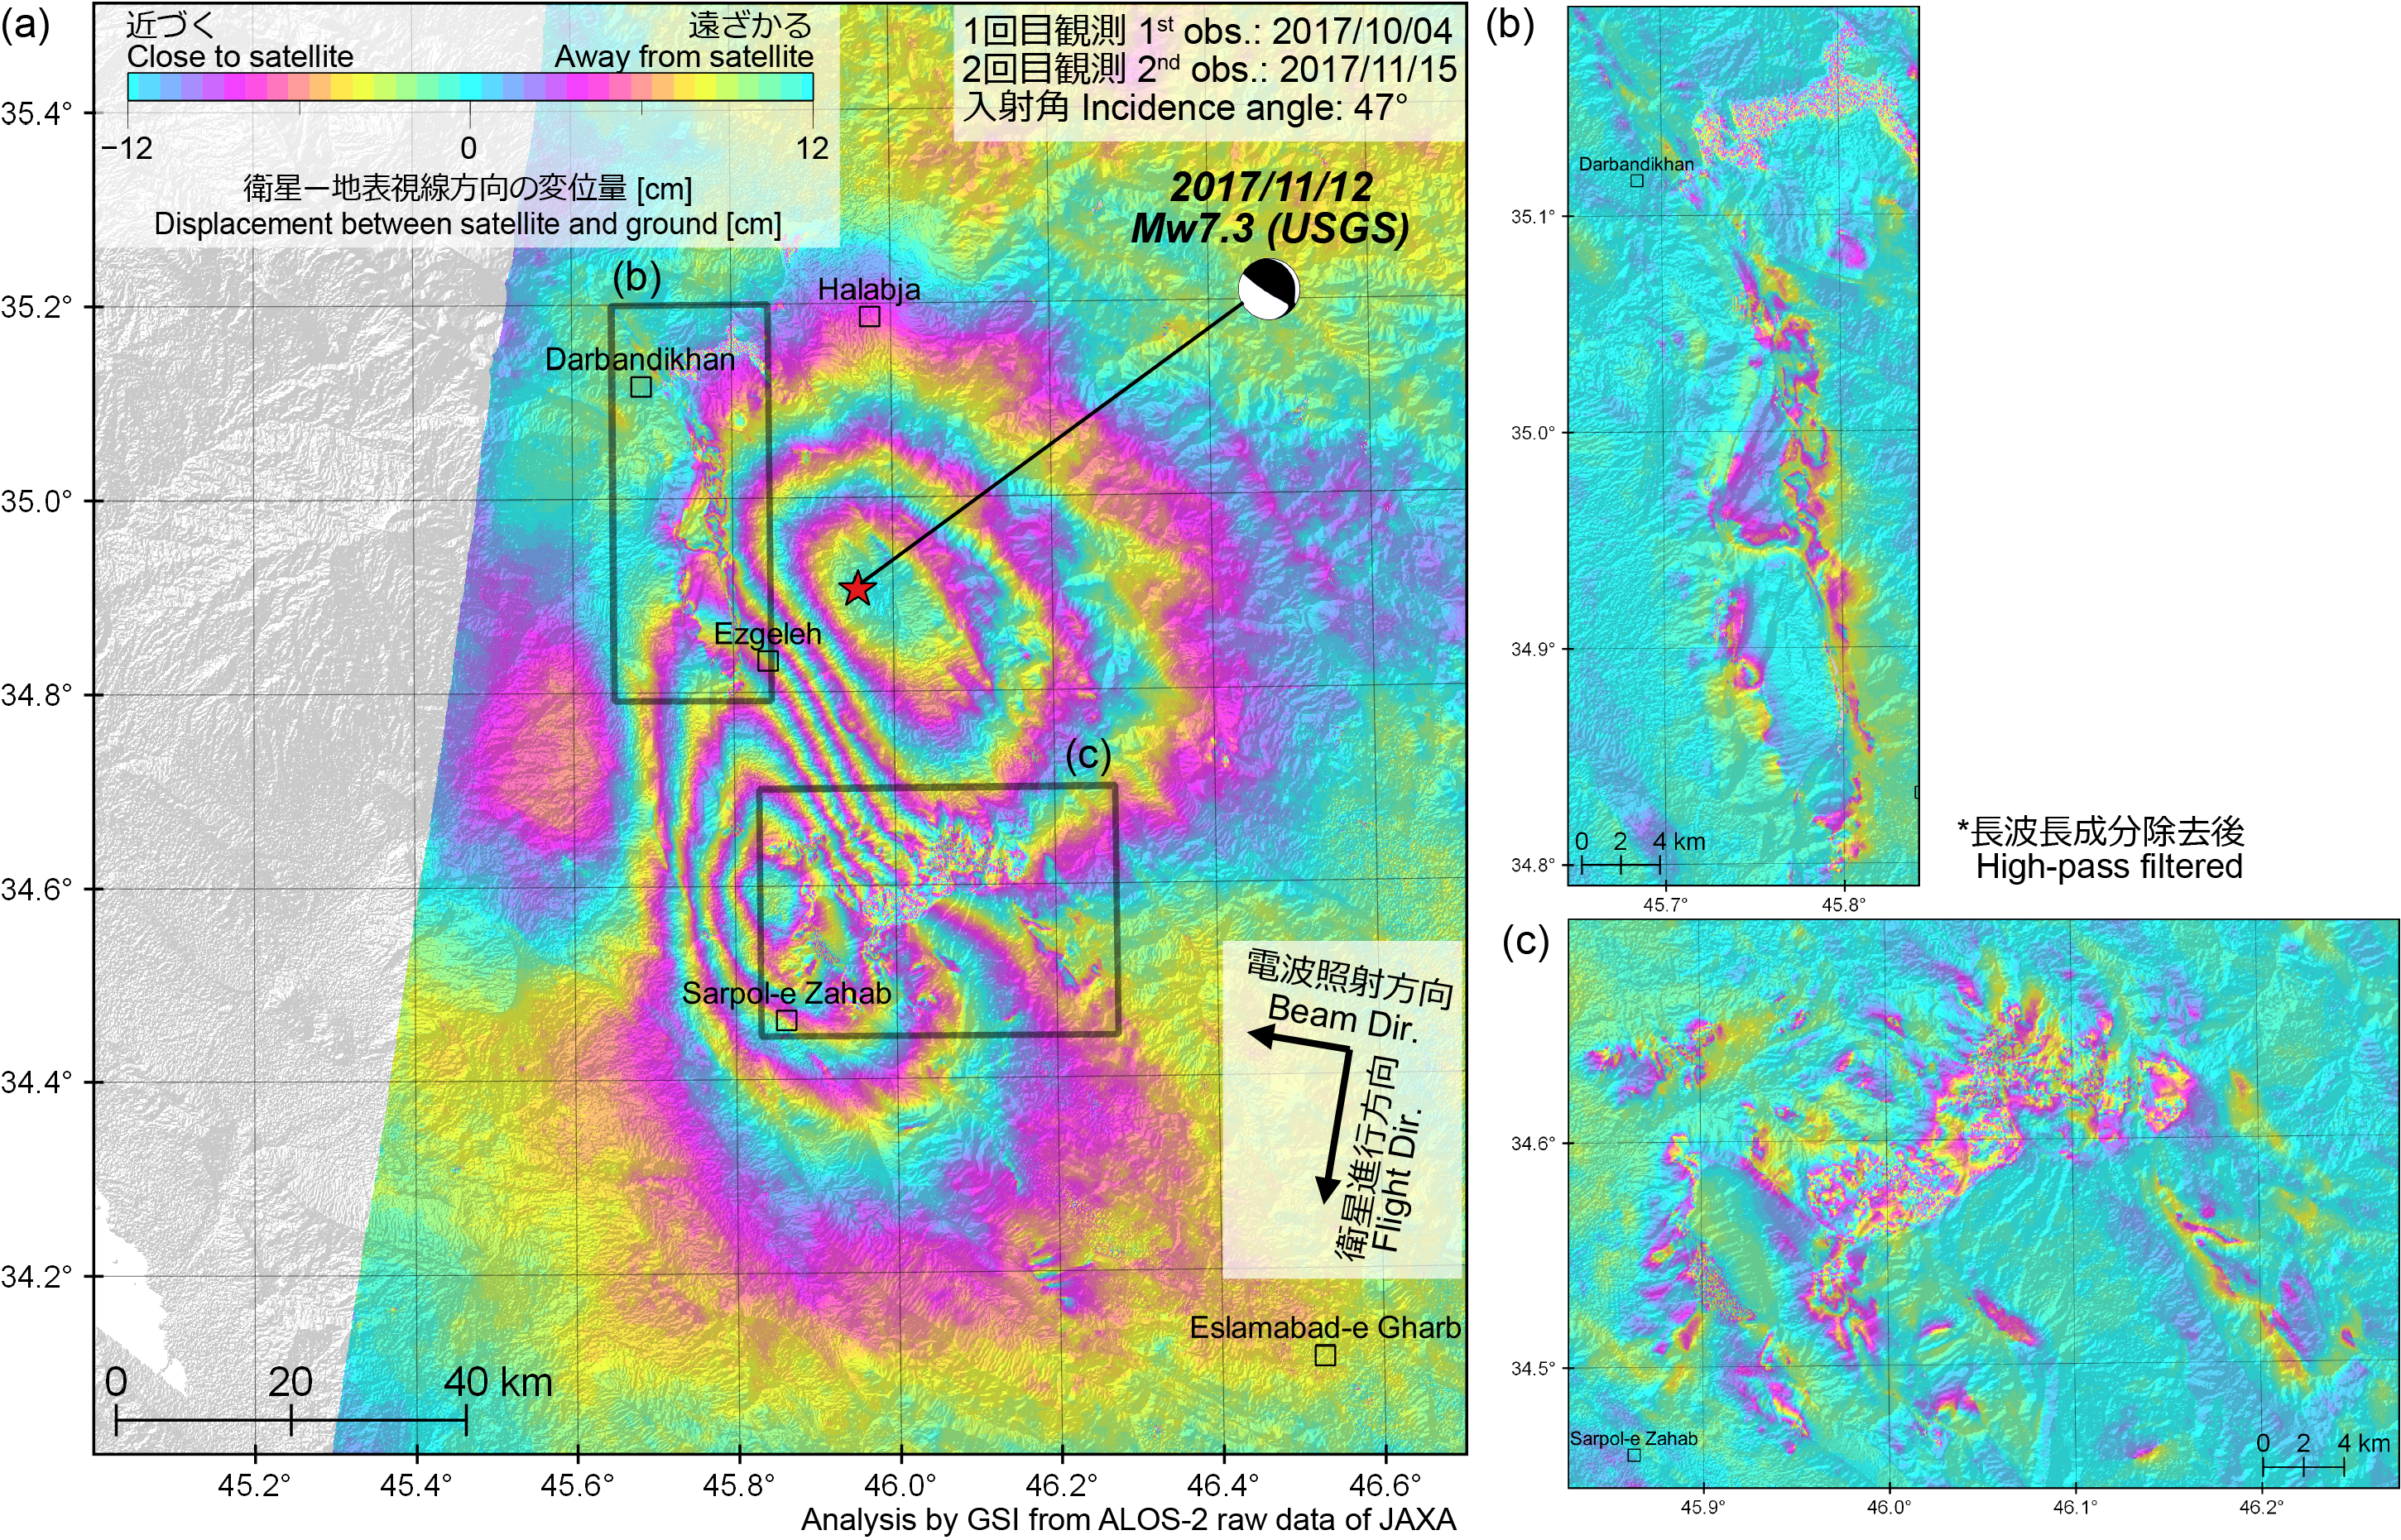 Fig. 5. [PNG:6.06MB]
*1 W:ScanSAR (Normal) (cf. ALOS-2 Project / PALSAR-2 (JAXA)) 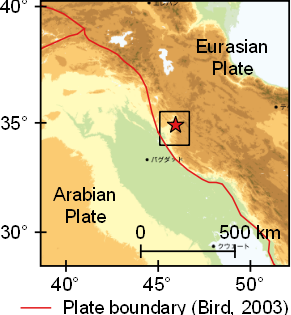 Fig. 6. Area of interest Analysis by GSI from ALOS-2 raw data of JAXA. These results were obtained through the activity of the SAR analysis working group of the Coordinating Committee for Earthquake Prediction. Fault modelThe 2017 Iran-Iraq Earthquake
SatelliteALOS-2 (Advanced Land Observing Satellite 2) launched by Japan Aerospace Exploration Agency on May 24, 2014
Paper, Report, PresentationKobayashi, T., Y. Morishita, H. Yarai, and S. Fujiwara (2018), InSAR-derived Crustal Deformation and Reverse Fault Motion of the 2017 Iran-Iraq Earthquake in the Northwest of the Zagros Orogenic Belt, Bull. Geospatial Info. Auth., 66. [PDF: 1.3MB]
Copyrights and CreditsCopyright. Geospatial Information Authority of Japan. ALL RIGHTS RESERVED.
We welcome links from your website to this website. When using materials on this website, we ask that proper credit be given. ContactYARAI Hiroshi : Head of Division
KOBAYASHI Tomokazu : Chief Researcher MORISHITA Yu : Chief Researcher 
|